| Full name: leptin | Alias Symbol: | ||
| Type: protein-coding gene | Cytoband: 7q32.1 | ||
| Entrez ID: 3952 | HGNC ID: HGNC:6553 | Ensembl Gene: ENSG00000174697 | OMIM ID: 164160 |
| Related drugs: BROMOCRIPTINE, CARVEDILOL, CLOZAPINE, ESTRADIOL VALERATE, FELODIPINE, FOLIC ACID, GEMFIBROZIL, LAMIVUDINE, LOVASTATIN, METHADONE... [more] | |||
LEP involved pathways:
| KEGG pathway | Description | View |
|---|---|---|
| hsa04152 | AMPK signaling pathway | |
| hsa04630 | Jak-STAT signaling pathway | |
| hsa04920 | Adipocytokine signaling pathway | |
| hsa04932 | Non-alcoholic fatty liver disease (NAFLD) |
Expression of LEP:
| Dataset | Gene | EntrezID | Probe | Log2FC | Adj.pValue | Expression |
|---|---|---|---|---|---|---|
| GSE17351 | LEP | 3952 | 207092_at | 0.6502 | 0.3958 | |
| GSE20347 | LEP | 3952 | 207092_at | 0.1911 | 0.1037 | |
| GSE23400 | LEP | 3952 | 207092_at | 0.0472 | 0.3810 | |
| GSE26886 | LEP | 3952 | 207092_at | 0.3020 | 0.3003 | |
| GSE29001 | LEP | 3952 | 207092_at | 0.4580 | 0.2206 | |
| GSE38129 | LEP | 3952 | 207092_at | -0.2256 | 0.3702 | |
| GSE45670 | LEP | 3952 | 207092_at | 0.3142 | 0.0041 | |
| GSE53622 | LEP | 3952 | 13123 | -1.9517 | 0.0000 | |
| GSE53624 | LEP | 3952 | 13123 | -3.0150 | 0.0000 | |
| GSE63941 | LEP | 3952 | 207092_at | 0.0482 | 0.7893 | |
| GSE77861 | LEP | 3952 | 207092_at | -0.0673 | 0.5402 | |
| GSE97050 | LEP | 3952 | A_24_P397817 | -0.6464 | 0.2881 | |
| TCGA | LEP | 3952 | RNAseq | 0.9125 | 0.2349 |
Upregulated datasets: 0; Downregulated datasets: 2.
Survival by LEP expression:
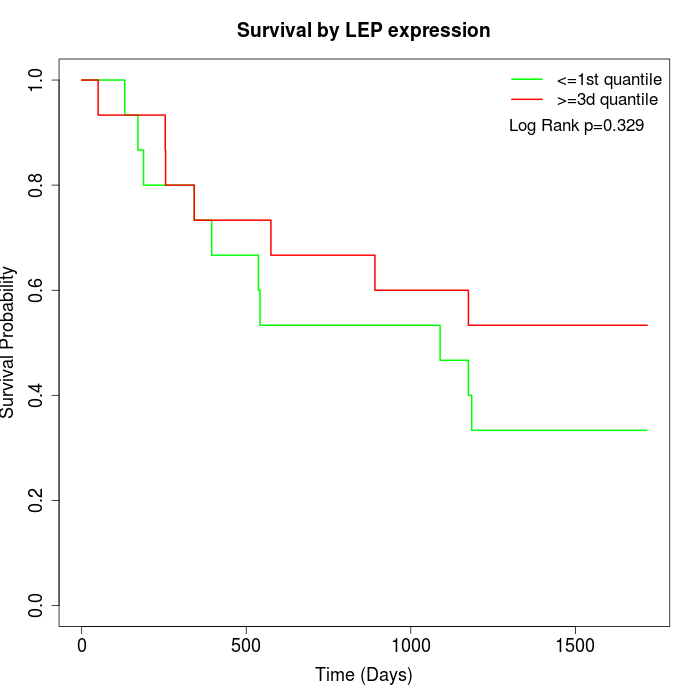 | 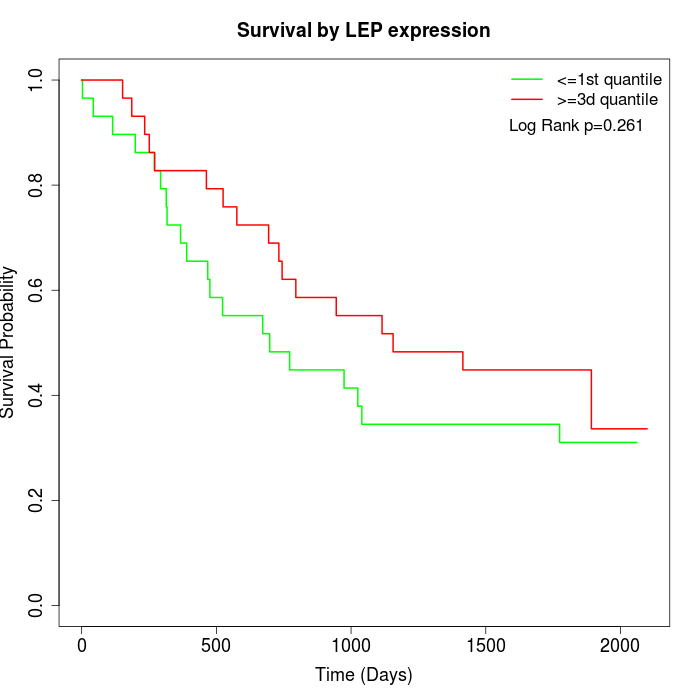 | 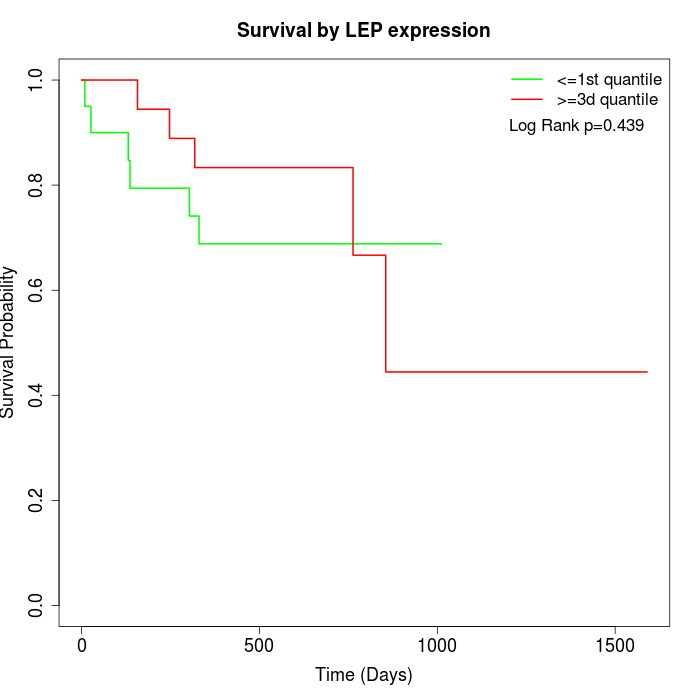 |
| GSE53622 | GSE53624 | TCGA |
Note: Click image to view full size file.
Copy number change of LEP:
| Dataset | Gene | EntrezID | Gain | Loss | Normal | Detail |
|---|---|---|---|---|---|---|
| GSE15526 | LEP | 3952 | 8 | 1 | 21 | |
| GSE20123 | LEP | 3952 | 8 | 2 | 20 | |
| GSE43470 | LEP | 3952 | 2 | 3 | 38 | |
| GSE46452 | LEP | 3952 | 7 | 2 | 50 | |
| GSE47630 | LEP | 3952 | 7 | 4 | 29 | |
| GSE54993 | LEP | 3952 | 3 | 5 | 62 | |
| GSE54994 | LEP | 3952 | 7 | 10 | 36 | |
| GSE60625 | LEP | 3952 | 0 | 0 | 11 | |
| GSE74703 | LEP | 3952 | 2 | 3 | 31 | |
| GSE74704 | LEP | 3952 | 4 | 2 | 14 | |
| TCGA | LEP | 3952 | 28 | 22 | 46 |
Total number of gains: 76; Total number of losses: 54; Total Number of normals: 358.
Somatic mutations of LEP:
Generating mutation plots.
Highly correlated genes for LEP:
Showing top 20/127 corelated genes with mean PCC>0.5.
| Gene1 | Gene2 | Mean PCC | Num. Datasets | Num. PCC<0 | Num. PCC>0.5 |
|---|---|---|---|---|---|
| LEP | TDRD9 | 0.830619 | 3 | 0 | 3 |
| LEP | IRF3 | 0.758701 | 3 | 0 | 3 |
| LEP | NCCRP1 | 0.733377 | 3 | 0 | 3 |
| LEP | RNF222 | 0.717904 | 3 | 0 | 3 |
| LEP | TUBGCP6 | 0.717707 | 4 | 0 | 3 |
| LEP | BTNL9 | 0.716954 | 3 | 0 | 3 |
| LEP | KRTAP4-1 | 0.713227 | 4 | 0 | 4 |
| LEP | IQCF1 | 0.711483 | 3 | 0 | 3 |
| LEP | SEPSECS-AS1 | 0.70023 | 3 | 0 | 3 |
| LEP | TMPRSS11A | 0.694672 | 3 | 0 | 3 |
| LEP | HES5 | 0.691285 | 3 | 0 | 3 |
| LEP | NOTO | 0.691245 | 3 | 0 | 3 |
| LEP | OR10G8 | 0.689903 | 3 | 0 | 3 |
| LEP | OTOP3 | 0.688457 | 3 | 0 | 3 |
| LEP | SRD5A3-AS1 | 0.68112 | 3 | 0 | 3 |
| LEP | C3orf20 | 0.674071 | 3 | 0 | 3 |
| LEP | FAM163B | 0.673072 | 3 | 0 | 3 |
| LEP | KRT83 | 0.664288 | 3 | 0 | 3 |
| LEP | PTCH2 | 0.663062 | 3 | 0 | 3 |
| LEP | SRCAP | 0.655788 | 4 | 0 | 3 |
For details and further investigation, click here