| Full name: leiomodin 3 | Alias Symbol: | ||
| Type: protein-coding gene | Cytoband: 3p14.1 | ||
| Entrez ID: 56203 | HGNC ID: HGNC:6649 | Ensembl Gene: ENSG00000163380 | OMIM ID: 616112 |
Expression of LMOD3:
| Dataset | Gene | EntrezID | Probe | Log2FC | Adj.pValue | Expression |
|---|---|---|---|---|---|---|
| GSE17351 | LMOD3 | 56203 | 1555567_s_at | -0.0230 | 0.9307 | |
| GSE26886 | LMOD3 | 56203 | 1555567_s_at | -0.1320 | 0.2262 | |
| GSE45670 | LMOD3 | 56203 | 243346_at | -0.2672 | 0.0030 | |
| GSE53622 | LMOD3 | 56203 | 53185 | -0.2908 | 0.0016 | |
| GSE53624 | LMOD3 | 56203 | 53185 | -0.1390 | 0.3622 | |
| GSE63941 | LMOD3 | 56203 | 1555567_s_at | 0.1049 | 0.3788 | |
| GSE77861 | LMOD3 | 56203 | 1555567_s_at | -0.0137 | 0.8851 | |
| GSE97050 | LMOD3 | 56203 | A_33_P3295253 | -0.6691 | 0.3042 | |
| SRP064894 | LMOD3 | 56203 | RNAseq | -0.5512 | 0.1725 | |
| SRP133303 | LMOD3 | 56203 | RNAseq | -0.8853 | 0.0037 | |
| SRP159526 | LMOD3 | 56203 | RNAseq | -0.9857 | 0.0903 | |
| SRP193095 | LMOD3 | 56203 | RNAseq | 0.0198 | 0.8983 | |
| TCGA | LMOD3 | 56203 | RNAseq | -1.8218 | 0.0010 |
Upregulated datasets: 0; Downregulated datasets: 1.
Survival by LMOD3 expression:
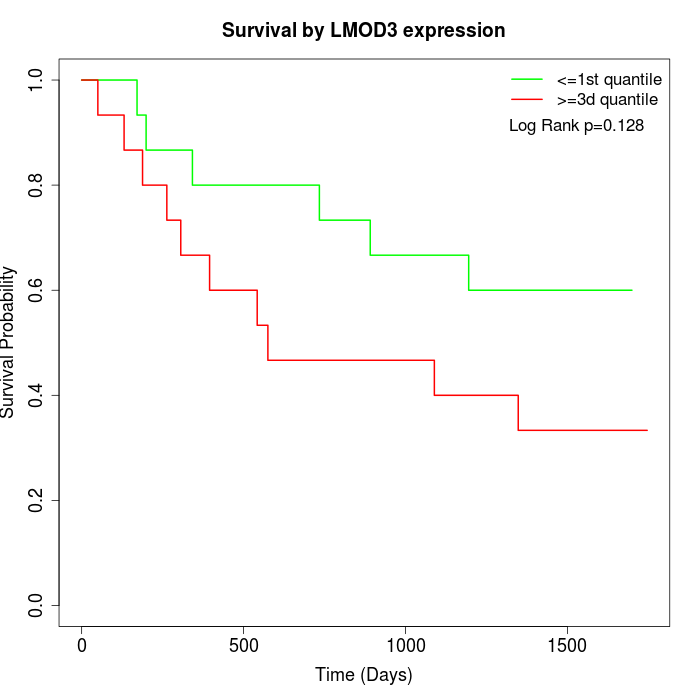 | 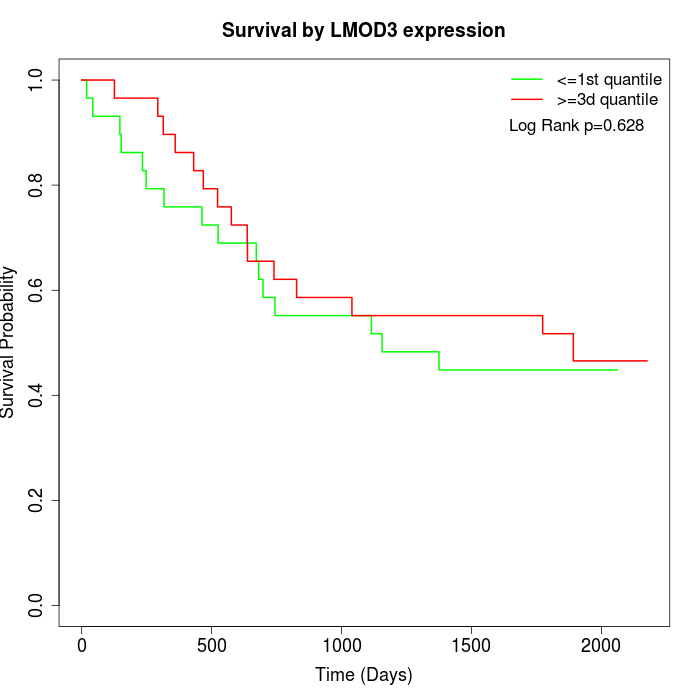 | 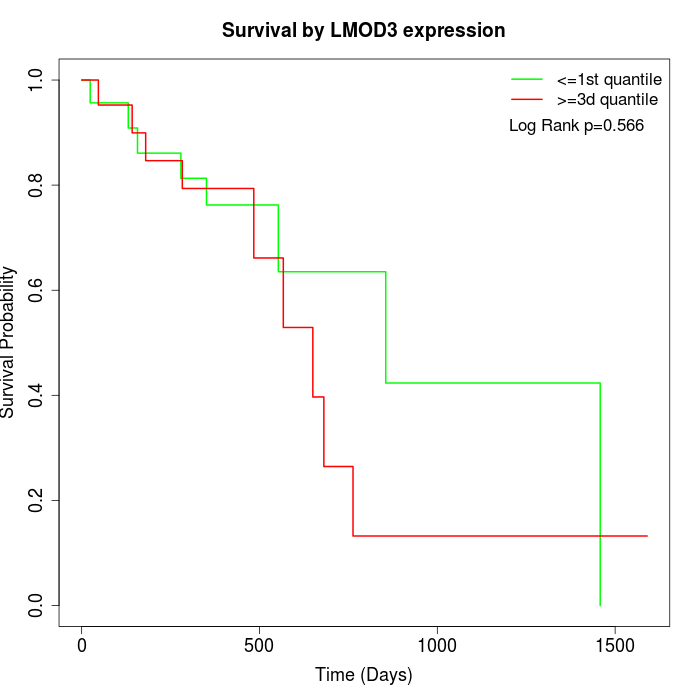 |
| GSE53622 | GSE53624 | TCGA |
Note: Click image to view full size file.
Copy number change of LMOD3:
| Dataset | Gene | EntrezID | Gain | Loss | Normal | Detail |
|---|---|---|---|---|---|---|
| GSE15526 | LMOD3 | 56203 | 1 | 19 | 10 | |
| GSE20123 | LMOD3 | 56203 | 1 | 19 | 10 | |
| GSE43470 | LMOD3 | 56203 | 0 | 20 | 23 | |
| GSE46452 | LMOD3 | 56203 | 2 | 17 | 40 | |
| GSE47630 | LMOD3 | 56203 | 1 | 23 | 16 | |
| GSE54993 | LMOD3 | 56203 | 5 | 3 | 62 | |
| GSE54994 | LMOD3 | 56203 | 1 | 33 | 19 | |
| GSE60625 | LMOD3 | 56203 | 3 | 1 | 7 | |
| GSE74703 | LMOD3 | 56203 | 0 | 16 | 20 | |
| GSE74704 | LMOD3 | 56203 | 1 | 13 | 6 | |
| TCGA | LMOD3 | 56203 | 0 | 79 | 17 |
Total number of gains: 15; Total number of losses: 243; Total Number of normals: 230.
Somatic mutations of LMOD3:
Generating mutation plots.
Highly correlated genes for LMOD3:
Showing top 20/80 corelated genes with mean PCC>0.5.
| Gene1 | Gene2 | Mean PCC | Num. Datasets | Num. PCC<0 | Num. PCC>0.5 |
|---|---|---|---|---|---|
| LMOD3 | ALPP | 0.76379 | 3 | 0 | 3 |
| LMOD3 | LINC01255 | 0.704181 | 3 | 0 | 3 |
| LMOD3 | ASB16 | 0.687589 | 3 | 0 | 3 |
| LMOD3 | FAIM2 | 0.662148 | 3 | 0 | 3 |
| LMOD3 | GSTM5 | 0.658941 | 4 | 0 | 4 |
| LMOD3 | RAP1GAP | 0.651202 | 3 | 0 | 3 |
| LMOD3 | PHOSPHO1 | 0.648193 | 3 | 0 | 3 |
| LMOD3 | PPY | 0.646001 | 4 | 0 | 4 |
| LMOD3 | SCAMP5 | 0.635827 | 3 | 0 | 3 |
| LMOD3 | CTIF | 0.634797 | 4 | 0 | 3 |
| LMOD3 | KRT81 | 0.627927 | 3 | 0 | 3 |
| LMOD3 | HIF3A | 0.626004 | 4 | 0 | 3 |
| LMOD3 | CCDC62 | 0.624104 | 3 | 0 | 3 |
| LMOD3 | TSPYL6 | 0.618337 | 3 | 0 | 3 |
| LMOD3 | TIAF1 | 0.618045 | 3 | 0 | 3 |
| LMOD3 | ACTRT1 | 0.617931 | 4 | 0 | 4 |
| LMOD3 | BRSK1 | 0.617249 | 4 | 0 | 3 |
| LMOD3 | PGLYRP2 | 0.615006 | 4 | 0 | 3 |
| LMOD3 | CLTCL1 | 0.607863 | 4 | 0 | 4 |
| LMOD3 | ENHO | 0.604811 | 5 | 0 | 5 |
For details and further investigation, click here