| Full name: TGFB1-induced anti-apoptotic factor 1 | Alias Symbol: | ||
| Type: protein-coding gene | Cytoband: 17q11.2 | ||
| Entrez ID: 9220 | HGNC ID: HGNC:11803 | Ensembl Gene: ENSG00000221995 | OMIM ID: 609517 |
Expression of TIAF1:
| Dataset | Gene | EntrezID | Probe | Log2FC | Adj.pValue | Expression |
|---|---|---|---|---|---|---|
| GSE17351 | TIAF1 | 9220 | 1560553_at | -0.2603 | 0.3989 | |
| GSE26886 | TIAF1 | 9220 | 1560553_at | -0.3420 | 0.0089 | |
| GSE45670 | TIAF1 | 9220 | 1560553_at | 0.1723 | 0.2037 | |
| GSE63941 | TIAF1 | 9220 | 1560553_at | 0.0329 | 0.8096 | |
| GSE77861 | TIAF1 | 9220 | 1560553_at | -0.2189 | 0.0133 | |
| SRP007169 | TIAF1 | 9220 | RNAseq | -0.8854 | 0.2601 | |
| SRP064894 | TIAF1 | 9220 | RNAseq | 0.2622 | 0.5412 | |
| SRP133303 | TIAF1 | 9220 | RNAseq | -1.1048 | 0.0000 | |
| SRP159526 | TIAF1 | 9220 | RNAseq | -0.3133 | 0.6523 | |
| SRP193095 | TIAF1 | 9220 | RNAseq | -0.7398 | 0.0002 | |
| SRP219564 | TIAF1 | 9220 | RNAseq | -0.4180 | 0.3423 | |
| TCGA | TIAF1 | 9220 | RNAseq | -0.2262 | 0.0022 |
Upregulated datasets: 0; Downregulated datasets: 1.
Survival by TIAF1 expression:
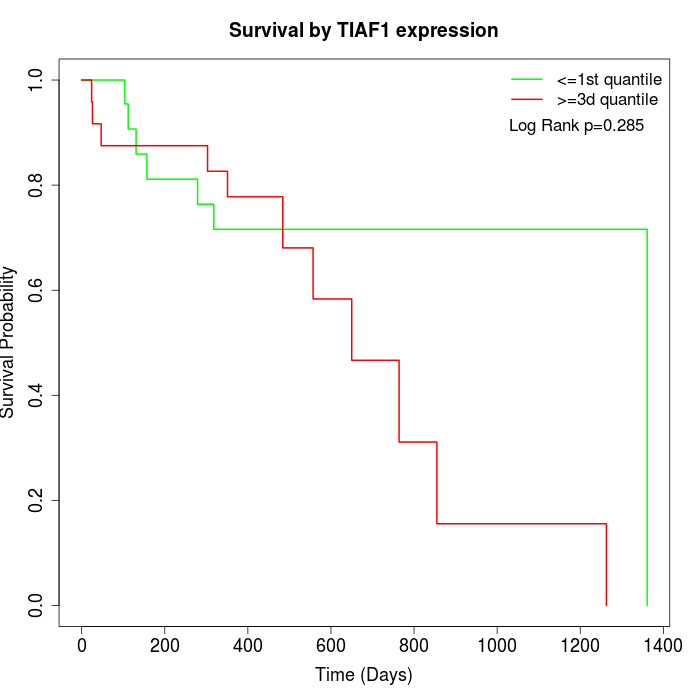 |
| TCGA |
Note: Click image to view full size file.
Copy number change of TIAF1:
| Dataset | Gene | EntrezID | Gain | Loss | Normal | Detail |
|---|---|---|---|---|---|---|
| GSE15526 | TIAF1 | 9220 | 10 | 1 | 19 | |
| GSE20123 | TIAF1 | 9220 | 9 | 1 | 20 | |
| GSE43470 | TIAF1 | 9220 | 0 | 1 | 42 | |
| GSE46452 | TIAF1 | 9220 | 33 | 1 | 25 | |
| GSE47630 | TIAF1 | 9220 | 7 | 1 | 32 | |
| GSE54993 | TIAF1 | 9220 | 2 | 3 | 65 | |
| GSE54994 | TIAF1 | 9220 | 7 | 6 | 40 | |
| GSE60625 | TIAF1 | 9220 | 4 | 0 | 7 | |
| GSE74703 | TIAF1 | 9220 | 0 | 1 | 35 | |
| GSE74704 | TIAF1 | 9220 | 6 | 1 | 13 | |
| TCGA | TIAF1 | 9220 | 21 | 10 | 65 |
Total number of gains: 99; Total number of losses: 26; Total Number of normals: 363.
Somatic mutations of TIAF1:
Generating mutation plots.
Highly correlated genes for TIAF1:
Showing top 20/301 corelated genes with mean PCC>0.5.
| Gene1 | Gene2 | Mean PCC | Num. Datasets | Num. PCC<0 | Num. PCC>0.5 |
|---|---|---|---|---|---|
| TIAF1 | EHD3 | 0.74514 | 3 | 0 | 3 |
| TIAF1 | SLURP1 | 0.739064 | 3 | 0 | 3 |
| TIAF1 | CXCR2 | 0.728841 | 3 | 0 | 3 |
| TIAF1 | TGM3 | 0.727592 | 3 | 0 | 3 |
| TIAF1 | PDLIM5 | 0.723806 | 3 | 0 | 3 |
| TIAF1 | GAB2 | 0.721955 | 3 | 0 | 3 |
| TIAF1 | ABLIM1 | 0.719263 | 3 | 0 | 3 |
| TIAF1 | FNDC4 | 0.718537 | 3 | 0 | 3 |
| TIAF1 | KRT76 | 0.715204 | 3 | 0 | 3 |
| TIAF1 | FAM3D | 0.711034 | 3 | 0 | 3 |
| TIAF1 | CPPED1 | 0.709094 | 3 | 0 | 3 |
| TIAF1 | AGFG2 | 0.706058 | 3 | 0 | 3 |
| TIAF1 | ST3GAL4 | 0.704447 | 3 | 0 | 3 |
| TIAF1 | SFTA2 | 0.6995 | 3 | 0 | 3 |
| TIAF1 | VAT1 | 0.697485 | 3 | 0 | 3 |
| TIAF1 | TAAR5 | 0.696784 | 3 | 0 | 3 |
| TIAF1 | CRISP3 | 0.696424 | 3 | 0 | 3 |
| TIAF1 | GDPD3 | 0.693029 | 4 | 0 | 4 |
| TIAF1 | FBXL16 | 0.691621 | 3 | 0 | 3 |
| TIAF1 | XYLT1 | 0.688821 | 3 | 0 | 3 |
For details and further investigation, click here