| Full name: prolyl-tRNA synthetase 2, mitochondrial | Alias Symbol: DKFZp727A071 | ||
| Type: protein-coding gene | Cytoband: 1p32.3 | ||
| Entrez ID: 25973 | HGNC ID: HGNC:30563 | Ensembl Gene: ENSG00000162396 | OMIM ID: 612036 |
Screen Evidence:
| |||
Expression of PARS2:
| Dataset | Gene | EntrezID | Probe | Log2FC | Adj.pValue | Expression |
|---|---|---|---|---|---|---|
| GSE17351 | PARS2 | 25973 | 227348_at | 0.1223 | 0.8245 | |
| GSE26886 | PARS2 | 25973 | 227348_at | 0.2252 | 0.2306 | |
| GSE45670 | PARS2 | 25973 | 227348_at | 0.2221 | 0.0146 | |
| GSE53622 | PARS2 | 25973 | 78615 | 0.3263 | 0.0000 | |
| GSE53624 | PARS2 | 25973 | 78615 | 0.2874 | 0.0000 | |
| GSE63941 | PARS2 | 25973 | 227348_at | 1.2602 | 0.0136 | |
| GSE77861 | PARS2 | 25973 | 227348_at | -0.1333 | 0.4388 | |
| GSE97050 | PARS2 | 25973 | A_23_P51291 | 0.2600 | 0.2495 | |
| SRP007169 | PARS2 | 25973 | RNAseq | 0.8167 | 0.1973 | |
| SRP064894 | PARS2 | 25973 | RNAseq | 0.0294 | 0.8793 | |
| SRP133303 | PARS2 | 25973 | RNAseq | 0.1920 | 0.2527 | |
| SRP159526 | PARS2 | 25973 | RNAseq | 0.8509 | 0.1351 | |
| SRP193095 | PARS2 | 25973 | RNAseq | 0.1997 | 0.1135 | |
| SRP219564 | PARS2 | 25973 | RNAseq | 0.5558 | 0.2001 | |
| TCGA | PARS2 | 25973 | RNAseq | -0.0297 | 0.6847 |
Upregulated datasets: 1; Downregulated datasets: 0.
Survival by PARS2 expression:
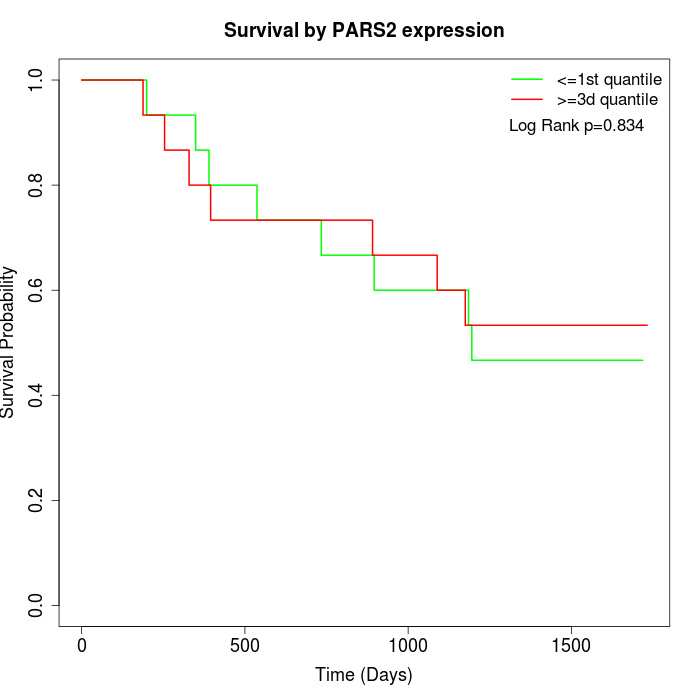 | 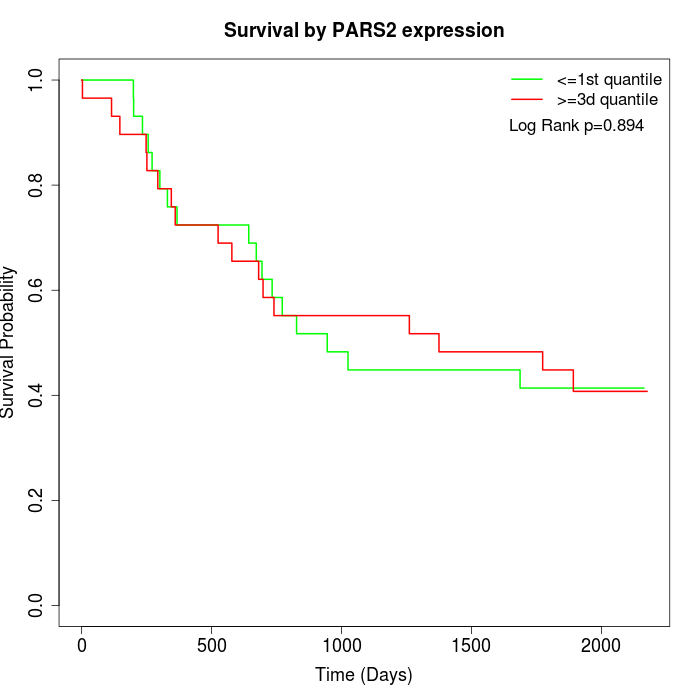 | 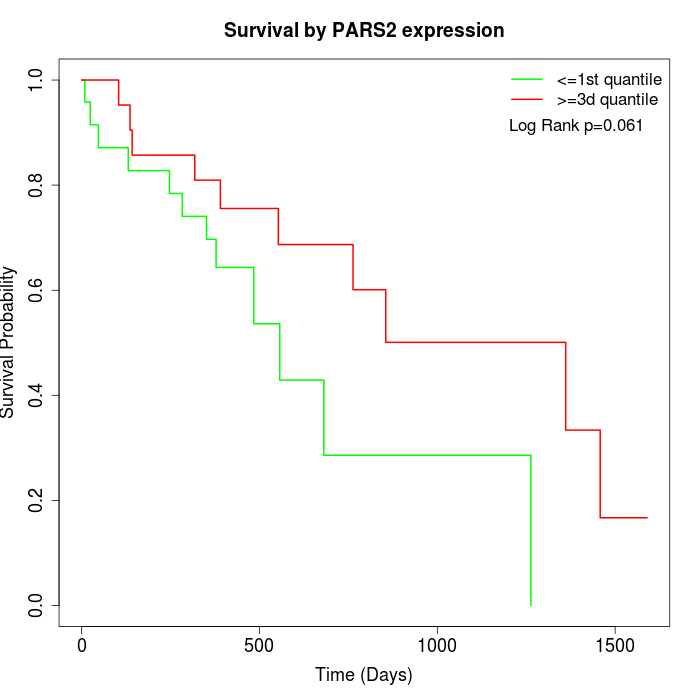 |
| GSE53622 | GSE53624 | TCGA |
Note: Click image to view full size file.
Copy number change of PARS2:
| Dataset | Gene | EntrezID | Gain | Loss | Normal | Detail |
|---|---|---|---|---|---|---|
| GSE15526 | PARS2 | 25973 | 3 | 3 | 24 | |
| GSE20123 | PARS2 | 25973 | 3 | 2 | 25 | |
| GSE43470 | PARS2 | 25973 | 7 | 2 | 34 | |
| GSE46452 | PARS2 | 25973 | 2 | 1 | 56 | |
| GSE47630 | PARS2 | 25973 | 8 | 4 | 28 | |
| GSE54993 | PARS2 | 25973 | 0 | 0 | 70 | |
| GSE54994 | PARS2 | 25973 | 10 | 3 | 40 | |
| GSE60625 | PARS2 | 25973 | 0 | 0 | 11 | |
| GSE74703 | PARS2 | 25973 | 5 | 1 | 30 | |
| GSE74704 | PARS2 | 25973 | 2 | 0 | 18 | |
| TCGA | PARS2 | 25973 | 10 | 18 | 68 |
Total number of gains: 50; Total number of losses: 34; Total Number of normals: 404.
Somatic mutations of PARS2:
Generating mutation plots.
Highly correlated genes for PARS2:
Showing top 20/178 corelated genes with mean PCC>0.5.
| Gene1 | Gene2 | Mean PCC | Num. Datasets | Num. PCC<0 | Num. PCC>0.5 |
|---|---|---|---|---|---|
| PARS2 | MIIP | 0.816673 | 3 | 0 | 3 |
| PARS2 | C7orf26 | 0.800928 | 3 | 0 | 3 |
| PARS2 | ZSWIM3 | 0.763262 | 4 | 0 | 4 |
| PARS2 | AKR7A3 | 0.752693 | 3 | 0 | 3 |
| PARS2 | KCNH3 | 0.75061 | 3 | 0 | 3 |
| PARS2 | KCNQ4 | 0.729816 | 3 | 0 | 3 |
| PARS2 | EDARADD | 0.725645 | 3 | 0 | 3 |
| PARS2 | AXIN1 | 0.722341 | 4 | 0 | 4 |
| PARS2 | UBN2 | 0.721988 | 3 | 0 | 3 |
| PARS2 | FUT1 | 0.713513 | 3 | 0 | 3 |
| PARS2 | ANKRD33B | 0.713109 | 3 | 0 | 3 |
| PARS2 | MS4A18 | 0.711753 | 3 | 0 | 3 |
| PARS2 | SLC23A3 | 0.708227 | 3 | 0 | 3 |
| PARS2 | ERBB2 | 0.684421 | 3 | 0 | 3 |
| PARS2 | CLN3 | 0.684202 | 4 | 0 | 4 |
| PARS2 | RIPK4 | 0.681841 | 3 | 0 | 3 |
| PARS2 | RBM25 | 0.680683 | 3 | 0 | 3 |
| PARS2 | POMT2 | 0.680305 | 3 | 0 | 3 |
| PARS2 | CAPN10 | 0.679179 | 3 | 0 | 3 |
| PARS2 | TOE1 | 0.67498 | 5 | 0 | 4 |
For details and further investigation, click here