| Full name: microtubule associated scaffold protein 1 | Alias Symbol: MTSG1|KIAA1288|DKFZp586D1519|FLJ14295|ATIP1|MP44|ATBP|ICIS|ATIP3 | ||
| Type: protein-coding gene | Cytoband: 8p22 | ||
| Entrez ID: 57509 | HGNC ID: HGNC:29789 | Ensembl Gene: ENSG00000129422 | OMIM ID: 609589 |
Expression of MTUS1:
| Dataset | Gene | EntrezID | Probe | Log2FC | Adj.pValue | Expression |
|---|---|---|---|---|---|---|
| GSE17351 | MTUS1 | 57509 | 212096_s_at | -0.2869 | 0.5750 | |
| GSE20347 | MTUS1 | 57509 | 212096_s_at | -0.0958 | 0.7158 | |
| GSE23400 | MTUS1 | 57509 | 212096_s_at | -0.0369 | 0.7767 | |
| GSE26886 | MTUS1 | 57509 | 212096_s_at | -0.4135 | 0.2162 | |
| GSE29001 | MTUS1 | 57509 | 212096_s_at | 0.0400 | 0.9343 | |
| GSE38129 | MTUS1 | 57509 | 212096_s_at | -0.3022 | 0.0643 | |
| GSE45670 | MTUS1 | 57509 | 212096_s_at | -0.5109 | 0.0105 | |
| GSE53622 | MTUS1 | 57509 | 21589 | -0.5260 | 0.0000 | |
| GSE53624 | MTUS1 | 57509 | 21589 | -0.4663 | 0.0000 | |
| GSE63941 | MTUS1 | 57509 | 212096_s_at | 2.2163 | 0.0600 | |
| GSE77861 | MTUS1 | 57509 | 212096_s_at | 0.3154 | 0.3555 | |
| GSE97050 | MTUS1 | 57509 | A_33_P3352253 | -0.3675 | 0.2827 | |
| SRP007169 | MTUS1 | 57509 | RNAseq | 0.4107 | 0.3188 | |
| SRP008496 | MTUS1 | 57509 | RNAseq | 0.2903 | 0.2277 | |
| SRP064894 | MTUS1 | 57509 | RNAseq | -0.2315 | 0.3781 | |
| SRP133303 | MTUS1 | 57509 | RNAseq | -0.6070 | 0.0155 | |
| SRP159526 | MTUS1 | 57509 | RNAseq | -0.2502 | 0.3384 | |
| SRP193095 | MTUS1 | 57509 | RNAseq | -0.4672 | 0.0075 | |
| SRP219564 | MTUS1 | 57509 | RNAseq | -0.3279 | 0.4681 | |
| TCGA | MTUS1 | 57509 | RNAseq | -0.3267 | 0.0000 |
Upregulated datasets: 0; Downregulated datasets: 0.
Survival by MTUS1 expression:
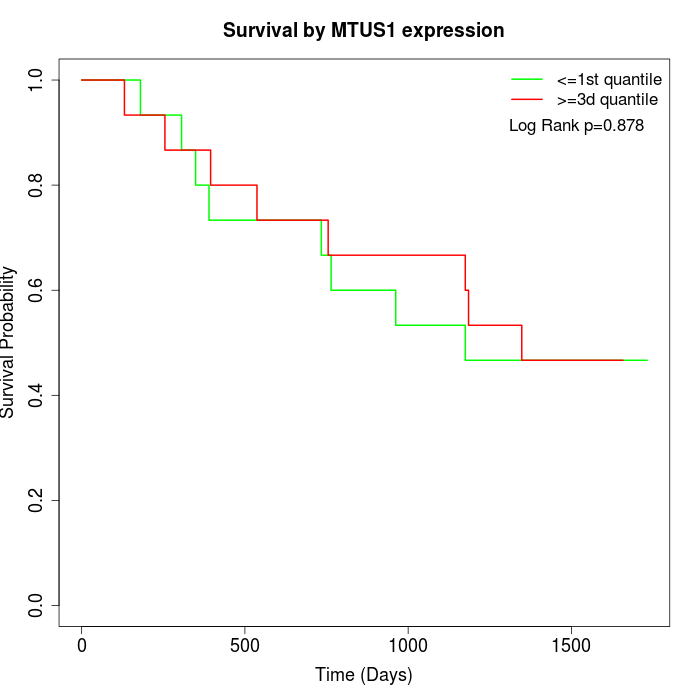 | 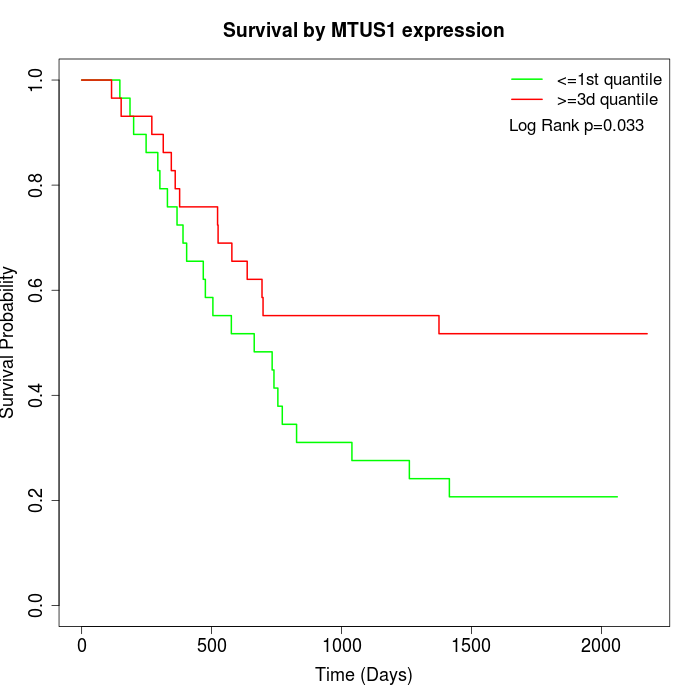 | 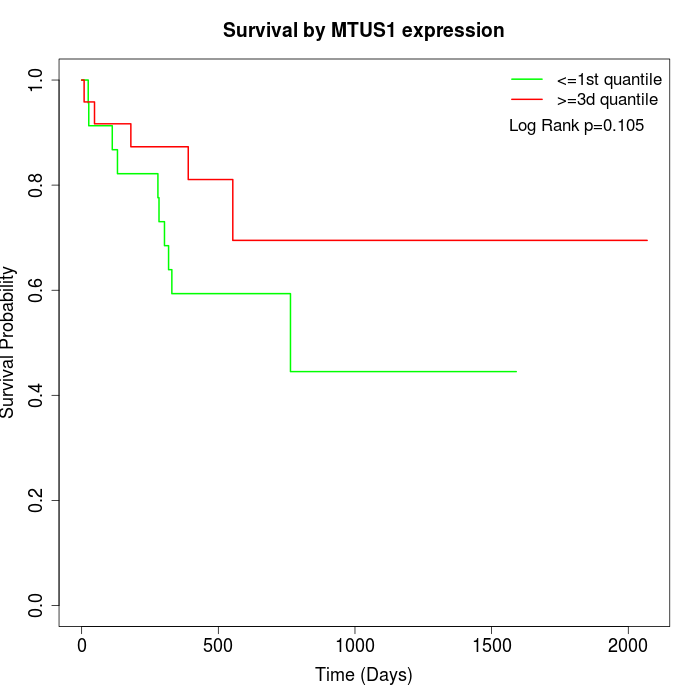 |
| GSE53622 | GSE53624 | TCGA |
Note: Click image to view full size file.
Copy number change of MTUS1:
| Dataset | Gene | EntrezID | Gain | Loss | Normal | Detail |
|---|---|---|---|---|---|---|
| GSE15526 | MTUS1 | 57509 | 3 | 10 | 17 | |
| GSE20123 | MTUS1 | 57509 | 4 | 10 | 16 | |
| GSE43470 | MTUS1 | 57509 | 4 | 8 | 31 | |
| GSE46452 | MTUS1 | 57509 | 14 | 13 | 32 | |
| GSE47630 | MTUS1 | 57509 | 10 | 8 | 22 | |
| GSE54993 | MTUS1 | 57509 | 2 | 14 | 54 | |
| GSE54994 | MTUS1 | 57509 | 8 | 18 | 27 | |
| GSE60625 | MTUS1 | 57509 | 3 | 0 | 8 | |
| GSE74703 | MTUS1 | 57509 | 4 | 7 | 25 | |
| GSE74704 | MTUS1 | 57509 | 3 | 7 | 10 | |
| TCGA | MTUS1 | 57509 | 13 | 41 | 42 |
Total number of gains: 68; Total number of losses: 136; Total Number of normals: 284.
Somatic mutations of MTUS1:
Generating mutation plots.
Highly correlated genes for MTUS1:
Showing top 20/306 corelated genes with mean PCC>0.5.
| Gene1 | Gene2 | Mean PCC | Num. Datasets | Num. PCC<0 | Num. PCC>0.5 |
|---|---|---|---|---|---|
| MTUS1 | RNF14 | 0.765086 | 3 | 0 | 3 |
| MTUS1 | GTF2B | 0.762099 | 3 | 0 | 3 |
| MTUS1 | KLHL13 | 0.759711 | 3 | 0 | 3 |
| MTUS1 | SENP8 | 0.758648 | 3 | 0 | 3 |
| MTUS1 | WDR20 | 0.741811 | 3 | 0 | 3 |
| MTUS1 | EPB41 | 0.733401 | 3 | 0 | 3 |
| MTUS1 | NAA35 | 0.729293 | 3 | 0 | 3 |
| MTUS1 | RMND1 | 0.724099 | 3 | 0 | 3 |
| MTUS1 | COMMD3 | 0.715876 | 3 | 0 | 3 |
| MTUS1 | TTI2 | 0.714407 | 4 | 0 | 3 |
| MTUS1 | VPS26A | 0.711393 | 4 | 0 | 4 |
| MTUS1 | GLCCI1 | 0.709402 | 3 | 0 | 3 |
| MTUS1 | IREB2 | 0.708412 | 4 | 0 | 3 |
| MTUS1 | ETFA | 0.704584 | 5 | 0 | 4 |
| MTUS1 | RPS24 | 0.702095 | 3 | 0 | 3 |
| MTUS1 | SDHB | 0.700166 | 4 | 0 | 4 |
| MTUS1 | ST13 | 0.696274 | 4 | 0 | 3 |
| MTUS1 | ACVR1B | 0.694829 | 3 | 0 | 3 |
| MTUS1 | TRIM61 | 0.694721 | 3 | 0 | 3 |
| MTUS1 | ASXL2 | 0.691753 | 5 | 0 | 4 |
For details and further investigation, click here