| Full name: erythrocyte membrane protein band 4.1 | Alias Symbol: 4.1R | ||
| Type: protein-coding gene | Cytoband: 1p35.3 | ||
| Entrez ID: 2035 | HGNC ID: HGNC:3377 | Ensembl Gene: ENSG00000159023 | OMIM ID: 130500 |
EPB41 involved pathways:
| KEGG pathway | Description | View |
|---|---|---|
| hsa04530 | Tight junction |
Expression of EPB41:
| Dataset | Gene | EntrezID | Probe | Log2FC | Adj.pValue | Expression |
|---|---|---|---|---|---|---|
| GSE17351 | EPB41 | 2035 | 225051_at | -0.5086 | 0.2499 | |
| GSE20347 | EPB41 | 2035 | 214530_x_at | -0.0834 | 0.3029 | |
| GSE23400 | EPB41 | 2035 | 214530_x_at | -0.1887 | 0.0000 | |
| GSE26886 | EPB41 | 2035 | 225051_at | -1.2386 | 0.0000 | |
| GSE29001 | EPB41 | 2035 | 214530_x_at | -0.4130 | 0.0018 | |
| GSE38129 | EPB41 | 2035 | 214530_x_at | -0.2212 | 0.0026 | |
| GSE45670 | EPB41 | 2035 | 225051_at | -0.2268 | 0.1938 | |
| GSE53622 | EPB41 | 2035 | 94428 | -0.6377 | 0.0000 | |
| GSE53624 | EPB41 | 2035 | 94428 | -1.0007 | 0.0000 | |
| GSE63941 | EPB41 | 2035 | 225051_at | 0.6355 | 0.1621 | |
| GSE77861 | EPB41 | 2035 | 225051_at | -0.7840 | 0.0018 | |
| GSE97050 | EPB41 | 2035 | A_23_P351 | -0.3885 | 0.3552 | |
| SRP007169 | EPB41 | 2035 | RNAseq | -0.7210 | 0.0321 | |
| SRP008496 | EPB41 | 2035 | RNAseq | -0.8445 | 0.0007 | |
| SRP064894 | EPB41 | 2035 | RNAseq | -1.2520 | 0.0000 | |
| SRP133303 | EPB41 | 2035 | RNAseq | -0.8108 | 0.0000 | |
| SRP159526 | EPB41 | 2035 | RNAseq | -0.5708 | 0.0019 | |
| SRP193095 | EPB41 | 2035 | RNAseq | -0.7485 | 0.0000 | |
| SRP219564 | EPB41 | 2035 | RNAseq | -1.1305 | 0.0027 | |
| TCGA | EPB41 | 2035 | RNAseq | -0.2763 | 0.0000 |
Upregulated datasets: 0; Downregulated datasets: 4.
Survival by EPB41 expression:
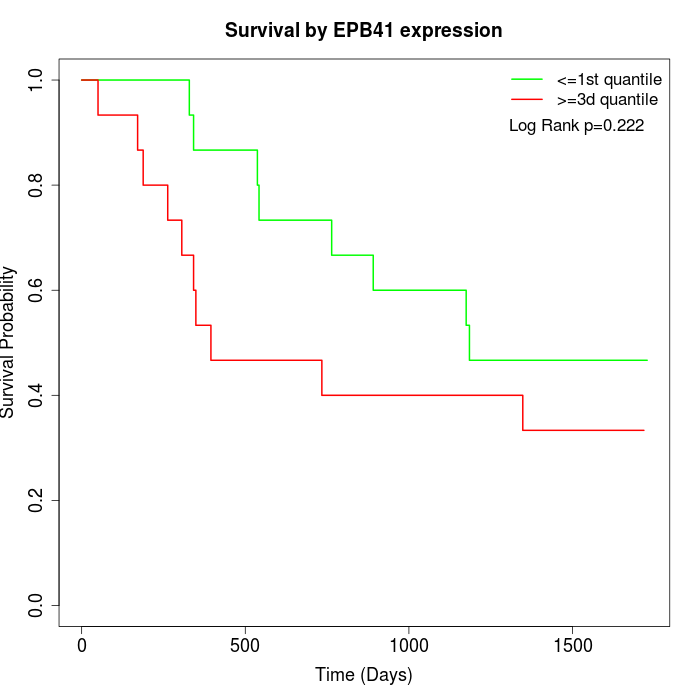 | 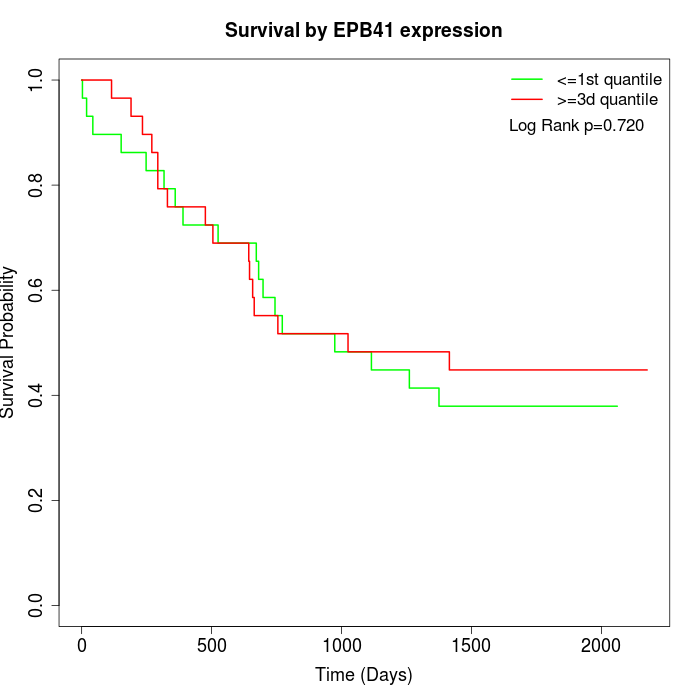 | 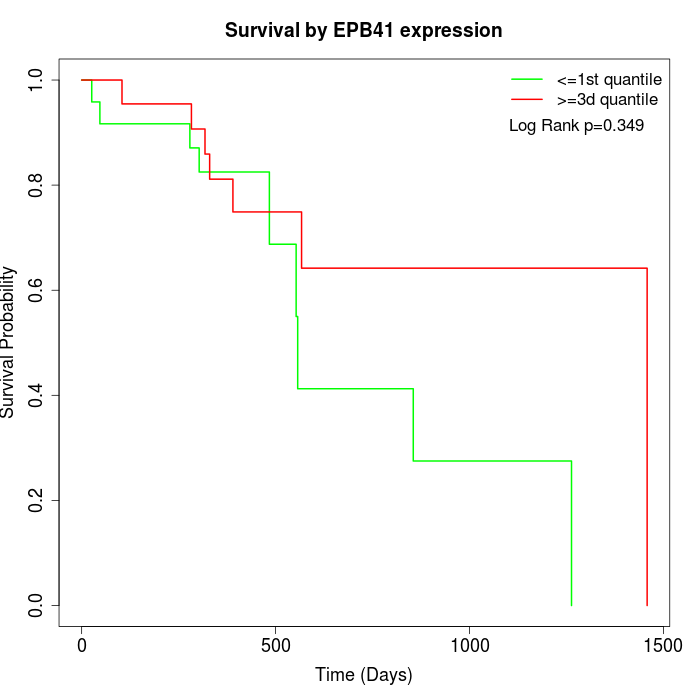 |
| GSE53622 | GSE53624 | TCGA |
Note: Click image to view full size file.
Copy number change of EPB41:
| Dataset | Gene | EntrezID | Gain | Loss | Normal | Detail |
|---|---|---|---|---|---|---|
| GSE15526 | EPB41 | 2035 | 0 | 6 | 24 | |
| GSE20123 | EPB41 | 2035 | 0 | 5 | 25 | |
| GSE43470 | EPB41 | 2035 | 3 | 6 | 34 | |
| GSE46452 | EPB41 | 2035 | 5 | 1 | 53 | |
| GSE47630 | EPB41 | 2035 | 8 | 3 | 29 | |
| GSE54993 | EPB41 | 2035 | 2 | 1 | 67 | |
| GSE54994 | EPB41 | 2035 | 10 | 4 | 39 | |
| GSE60625 | EPB41 | 2035 | 0 | 0 | 11 | |
| GSE74703 | EPB41 | 2035 | 2 | 4 | 30 | |
| GSE74704 | EPB41 | 2035 | 0 | 0 | 20 | |
| TCGA | EPB41 | 2035 | 11 | 21 | 64 |
Total number of gains: 41; Total number of losses: 51; Total Number of normals: 396.
Somatic mutations of EPB41:
Generating mutation plots.
Highly correlated genes for EPB41:
Showing top 20/1253 corelated genes with mean PCC>0.5.
| Gene1 | Gene2 | Mean PCC | Num. Datasets | Num. PCC<0 | Num. PCC>0.5 |
|---|---|---|---|---|---|
| EPB41 | FBXO9 | 0.820181 | 3 | 0 | 3 |
| EPB41 | TMCO4 | 0.779505 | 4 | 0 | 4 |
| EPB41 | SFTA2 | 0.771378 | 4 | 0 | 4 |
| EPB41 | SNORA68 | 0.752276 | 4 | 0 | 4 |
| EPB41 | EPS15 | 0.744543 | 5 | 0 | 5 |
| EPB41 | KLHDC8B | 0.743457 | 3 | 0 | 3 |
| EPB41 | TAB3 | 0.742752 | 7 | 0 | 7 |
| EPB41 | TYSND1 | 0.742461 | 4 | 0 | 3 |
| EPB41 | LNX1 | 0.739985 | 7 | 0 | 7 |
| EPB41 | NPBWR2 | 0.737497 | 3 | 0 | 3 |
| EPB41 | LCOR | 0.737243 | 3 | 0 | 3 |
| EPB41 | ZDHHC21 | 0.734152 | 6 | 0 | 5 |
| EPB41 | MTUS1 | 0.733401 | 3 | 0 | 3 |
| EPB41 | SLC44A3 | 0.726045 | 7 | 0 | 7 |
| EPB41 | GNG5 | 0.721142 | 4 | 0 | 3 |
| EPB41 | FCHO2 | 0.721044 | 7 | 0 | 7 |
| EPB41 | FAM95B1 | 0.71857 | 5 | 0 | 5 |
| EPB41 | ZNF823 | 0.714795 | 7 | 0 | 6 |
| EPB41 | RBM6 | 0.714039 | 3 | 0 | 3 |
| EPB41 | UBE2E2 | 0.71325 | 4 | 0 | 4 |
For details and further investigation, click here