| Full name: ST13 Hsp70 interacting protein | Alias Symbol: SNC6|HSPABP1|HIP|P48|FAM10A1 | ||
| Type: protein-coding gene | Cytoband: 22q13.2 | ||
| Entrez ID: 6767 | HGNC ID: HGNC:11343 | Ensembl Gene: ENSG00000100380 | OMIM ID: 606796 |
Screen Evidence:
| |||
Expression of ST13:
| Dataset | Gene | EntrezID | Probe | Log2FC | Adj.pValue | Expression |
|---|---|---|---|---|---|---|
| GSE17351 | ST13 | 6767 | 207040_s_at | -0.1974 | 0.6252 | |
| GSE20347 | ST13 | 6767 | 207040_s_at | -0.0517 | 0.7882 | |
| GSE23400 | ST13 | 6767 | 207040_s_at | 0.1554 | 0.0252 | |
| GSE26886 | ST13 | 6767 | 208667_s_at | 0.4931 | 0.0114 | |
| GSE29001 | ST13 | 6767 | 208667_s_at | -0.0060 | 0.9865 | |
| GSE38129 | ST13 | 6767 | 207040_s_at | -0.0112 | 0.9432 | |
| GSE45670 | ST13 | 6767 | 207040_s_at | -0.1054 | 0.5359 | |
| GSE53622 | ST13 | 6767 | 110068 | 0.1131 | 0.0452 | |
| GSE53624 | ST13 | 6767 | 110068 | 0.2602 | 0.0000 | |
| GSE63941 | ST13 | 6767 | 207040_s_at | 0.2489 | 0.4374 | |
| GSE77861 | ST13 | 6767 | 207040_s_at | 0.2976 | 0.2092 | |
| GSE97050 | ST13 | 6767 | A_32_P156892 | -0.1730 | 0.5079 | |
| SRP007169 | ST13 | 6767 | RNAseq | -0.2495 | 0.4221 | |
| SRP008496 | ST13 | 6767 | RNAseq | -0.2115 | 0.3430 | |
| SRP064894 | ST13 | 6767 | RNAseq | 0.0960 | 0.4925 | |
| SRP133303 | ST13 | 6767 | RNAseq | 0.0097 | 0.9329 | |
| SRP159526 | ST13 | 6767 | RNAseq | 0.3661 | 0.1029 | |
| SRP193095 | ST13 | 6767 | RNAseq | -0.0487 | 0.6713 | |
| SRP219564 | ST13 | 6767 | RNAseq | 0.1318 | 0.6837 | |
| TCGA | ST13 | 6767 | RNAseq | -0.0300 | 0.4652 |
Upregulated datasets: 0; Downregulated datasets: 0.
Survival by ST13 expression:
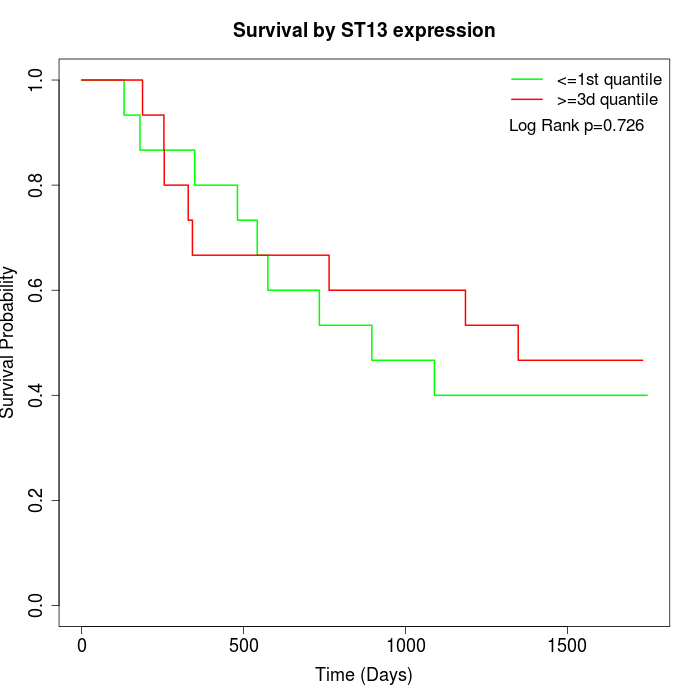 | 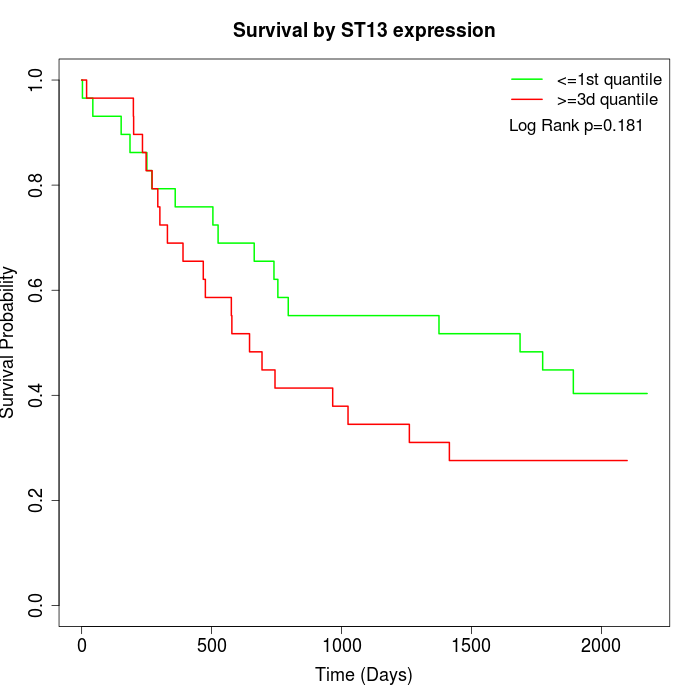 | 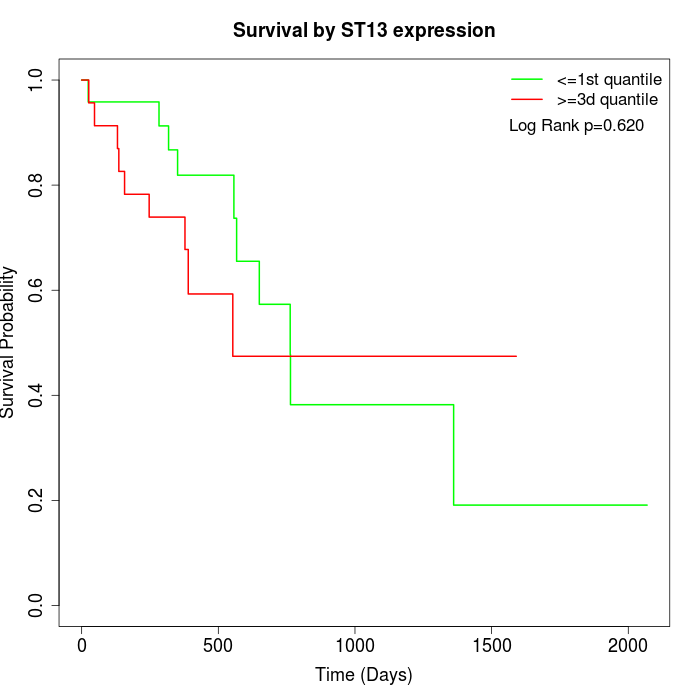 |
| GSE53622 | GSE53624 | TCGA |
Note: Click image to view full size file.
Copy number change of ST13:
| Dataset | Gene | EntrezID | Gain | Loss | Normal | Detail |
|---|---|---|---|---|---|---|
| GSE15526 | ST13 | 6767 | 6 | 5 | 19 | |
| GSE20123 | ST13 | 6767 | 6 | 4 | 20 | |
| GSE43470 | ST13 | 6767 | 4 | 6 | 33 | |
| GSE46452 | ST13 | 6767 | 31 | 2 | 26 | |
| GSE47630 | ST13 | 6767 | 9 | 4 | 27 | |
| GSE54993 | ST13 | 6767 | 3 | 6 | 61 | |
| GSE54994 | ST13 | 6767 | 11 | 7 | 35 | |
| GSE60625 | ST13 | 6767 | 5 | 0 | 6 | |
| GSE74703 | ST13 | 6767 | 4 | 4 | 28 | |
| GSE74704 | ST13 | 6767 | 3 | 2 | 15 | |
| TCGA | ST13 | 6767 | 26 | 15 | 55 |
Total number of gains: 108; Total number of losses: 55; Total Number of normals: 325.
Somatic mutations of ST13:
Generating mutation plots.
Highly correlated genes for ST13:
Showing top 20/541 corelated genes with mean PCC>0.5.
| Gene1 | Gene2 | Mean PCC | Num. Datasets | Num. PCC<0 | Num. PCC>0.5 |
|---|---|---|---|---|---|
| ST13 | UBR1 | 0.813544 | 3 | 0 | 3 |
| ST13 | ANO6 | 0.774178 | 3 | 0 | 3 |
| ST13 | SEMA3A | 0.731085 | 3 | 0 | 3 |
| ST13 | COMMD10 | 0.726502 | 4 | 0 | 4 |
| ST13 | STRN3 | 0.720474 | 3 | 0 | 3 |
| ST13 | RNASEH2C | 0.717325 | 3 | 0 | 3 |
| ST13 | ZNF655 | 0.707972 | 3 | 0 | 3 |
| ST13 | FBXO28 | 0.70728 | 3 | 0 | 3 |
| ST13 | NPTN | 0.697429 | 4 | 0 | 4 |
| ST13 | MTUS1 | 0.696274 | 4 | 0 | 3 |
| ST13 | FAM98B | 0.694108 | 4 | 0 | 3 |
| ST13 | CASC4 | 0.693108 | 4 | 0 | 3 |
| ST13 | SNRPG | 0.692428 | 4 | 0 | 4 |
| ST13 | DNMBP | 0.692342 | 3 | 0 | 3 |
| ST13 | SUMO2 | 0.69119 | 3 | 0 | 3 |
| ST13 | CFL2 | 0.689355 | 3 | 0 | 3 |
| ST13 | CCNC | 0.689203 | 4 | 0 | 4 |
| ST13 | DDX19A | 0.688193 | 4 | 0 | 3 |
| ST13 | MORF4L2 | 0.683766 | 3 | 0 | 3 |
| ST13 | PLEKHM3 | 0.681054 | 3 | 0 | 3 |
For details and further investigation, click here