| Full name: N(alpha)-acetyltransferase 35, NatC auxiliary subunit | Alias Symbol: FLJ21613|FLJ22643|bA379P1.1 | ||
| Type: protein-coding gene | Cytoband: 9q21.33 | ||
| Entrez ID: 60560 | HGNC ID: HGNC:24340 | Ensembl Gene: ENSG00000135040 | OMIM ID: |
Screen Evidence:
| |||
Expression of NAA35:
| Dataset | Gene | EntrezID | Probe | Log2FC | Adj.pValue | Expression |
|---|---|---|---|---|---|---|
| GSE17351 | NAA35 | 60560 | 220925_at | -0.2706 | 0.3970 | |
| GSE20347 | NAA35 | 60560 | 220925_at | -0.3994 | 0.0371 | |
| GSE23400 | NAA35 | 60560 | 220925_at | 0.1693 | 0.1143 | |
| GSE26886 | NAA35 | 60560 | 220925_at | -1.1908 | 0.0002 | |
| GSE29001 | NAA35 | 60560 | 220925_at | -0.0877 | 0.7793 | |
| GSE38129 | NAA35 | 60560 | 220925_at | -0.1820 | 0.1885 | |
| GSE45670 | NAA35 | 60560 | 220925_at | -0.0016 | 0.9943 | |
| GSE53622 | NAA35 | 60560 | 26446 | -0.2837 | 0.0000 | |
| GSE53624 | NAA35 | 60560 | 26446 | 0.1283 | 0.0435 | |
| GSE63941 | NAA35 | 60560 | 220925_at | 0.0122 | 0.9767 | |
| GSE77861 | NAA35 | 60560 | 219362_at | 0.0778 | 0.7101 | |
| GSE97050 | NAA35 | 60560 | A_33_P3299977 | -0.5211 | 0.1403 | |
| SRP007169 | NAA35 | 60560 | RNAseq | 0.3428 | 0.3285 | |
| SRP008496 | NAA35 | 60560 | RNAseq | 0.1411 | 0.5007 | |
| SRP064894 | NAA35 | 60560 | RNAseq | 0.0393 | 0.8349 | |
| SRP133303 | NAA35 | 60560 | RNAseq | -0.1513 | 0.1307 | |
| SRP159526 | NAA35 | 60560 | RNAseq | 0.0032 | 0.9888 | |
| SRP193095 | NAA35 | 60560 | RNAseq | -0.1154 | 0.2396 | |
| SRP219564 | NAA35 | 60560 | RNAseq | -0.2023 | 0.2633 | |
| TCGA | NAA35 | 60560 | RNAseq | -0.0243 | 0.6657 |
Upregulated datasets: 0; Downregulated datasets: 1.
Survival by NAA35 expression:
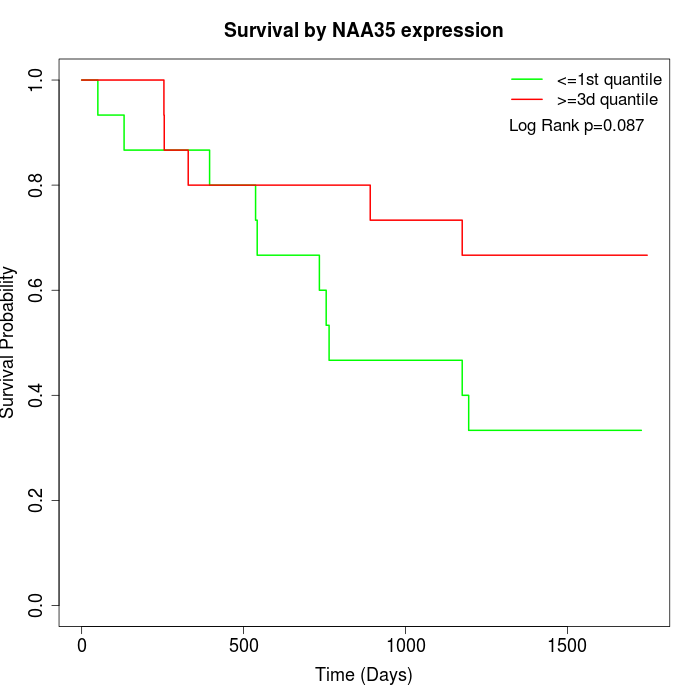 | 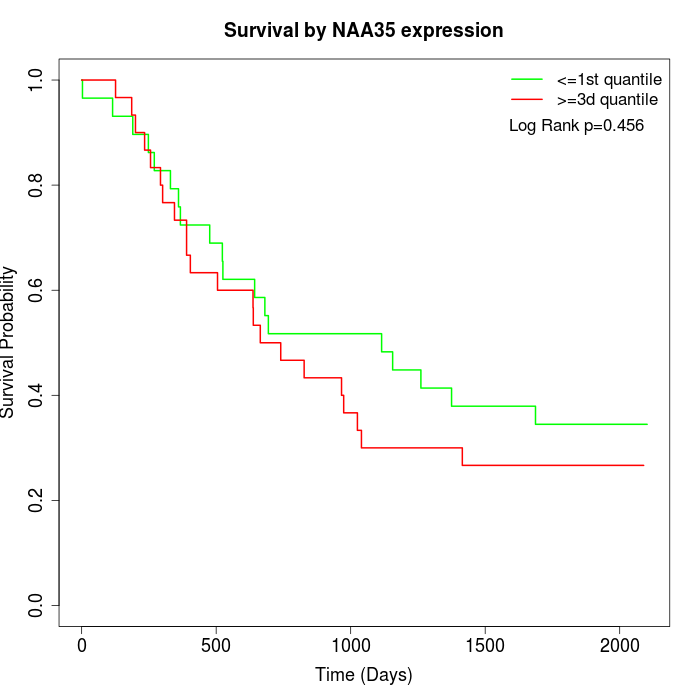 | 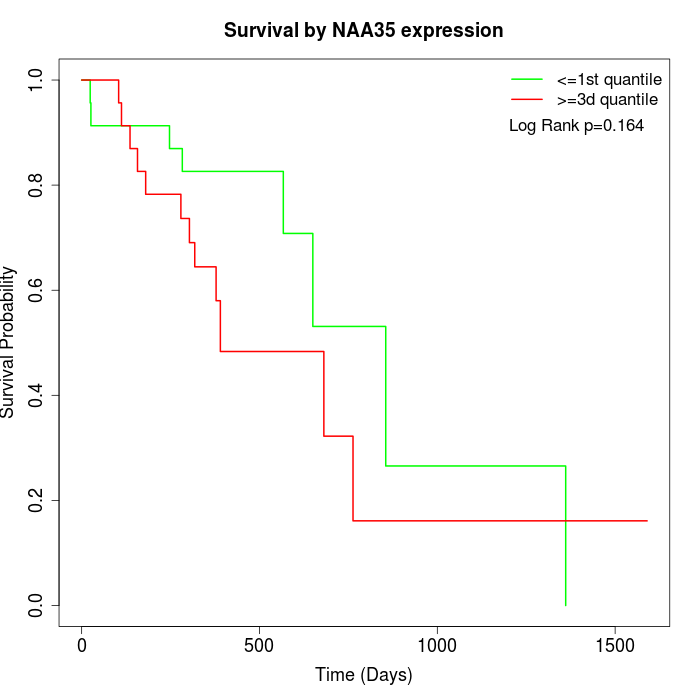 |
| GSE53622 | GSE53624 | TCGA |
Note: Click image to view full size file.
Copy number change of NAA35:
| Dataset | Gene | EntrezID | Gain | Loss | Normal | Detail |
|---|---|---|---|---|---|---|
| GSE15526 | NAA35 | 60560 | 5 | 10 | 15 | |
| GSE20123 | NAA35 | 60560 | 5 | 10 | 15 | |
| GSE43470 | NAA35 | 60560 | 6 | 3 | 34 | |
| GSE46452 | NAA35 | 60560 | 6 | 14 | 39 | |
| GSE47630 | NAA35 | 60560 | 1 | 18 | 21 | |
| GSE54993 | NAA35 | 60560 | 4 | 2 | 64 | |
| GSE54994 | NAA35 | 60560 | 6 | 12 | 35 | |
| GSE60625 | NAA35 | 60560 | 0 | 0 | 11 | |
| GSE74703 | NAA35 | 60560 | 5 | 3 | 28 | |
| GSE74704 | NAA35 | 60560 | 3 | 7 | 10 | |
| TCGA | NAA35 | 60560 | 20 | 27 | 49 |
Total number of gains: 61; Total number of losses: 106; Total Number of normals: 321.
Somatic mutations of NAA35:
Generating mutation plots.
Highly correlated genes for NAA35:
Showing top 20/454 corelated genes with mean PCC>0.5.
| Gene1 | Gene2 | Mean PCC | Num. Datasets | Num. PCC<0 | Num. PCC>0.5 |
|---|---|---|---|---|---|
| NAA35 | ACADSB | 0.830522 | 3 | 0 | 3 |
| NAA35 | ZNF570 | 0.82776 | 3 | 0 | 3 |
| NAA35 | PAIP2 | 0.812994 | 3 | 0 | 3 |
| NAA35 | NCOA2 | 0.806949 | 3 | 0 | 3 |
| NAA35 | APPL1 | 0.798131 | 3 | 0 | 3 |
| NAA35 | EPM2AIP1 | 0.78955 | 3 | 0 | 3 |
| NAA35 | SCOC | 0.788649 | 3 | 0 | 3 |
| NAA35 | TANC1 | 0.787034 | 3 | 0 | 3 |
| NAA35 | MKRN2 | 0.784042 | 3 | 0 | 3 |
| NAA35 | RALGAPA1 | 0.778961 | 3 | 0 | 3 |
| NAA35 | SACM1L | 0.776482 | 4 | 0 | 3 |
| NAA35 | COG6 | 0.773948 | 3 | 0 | 3 |
| NAA35 | STXBP5 | 0.7718 | 3 | 0 | 3 |
| NAA35 | HOOK3 | 0.769265 | 3 | 0 | 3 |
| NAA35 | SUPT4H1 | 0.762251 | 3 | 0 | 3 |
| NAA35 | SEMA4D | 0.759502 | 3 | 0 | 3 |
| NAA35 | SLU7 | 0.757914 | 3 | 0 | 3 |
| NAA35 | FAM83D | 0.752791 | 3 | 0 | 3 |
| NAA35 | BEX4 | 0.751789 | 3 | 0 | 3 |
| NAA35 | ARL6 | 0.745942 | 3 | 0 | 3 |
For details and further investigation, click here