| Full name: myosin regulatory light chain interacting protein | Alias Symbol: MIR|IDOL | ||
| Type: protein-coding gene | Cytoband: 6p22.3 | ||
| Entrez ID: 29116 | HGNC ID: HGNC:21155 | Ensembl Gene: ENSG00000007944 | OMIM ID: 610082 |
Expression of MYLIP:
| Dataset | Gene | EntrezID | Probe | Log2FC | Adj.pValue | Expression |
|---|---|---|---|---|---|---|
| GSE17351 | MYLIP | 29116 | 228098_s_at | 0.2507 | 0.7683 | |
| GSE20347 | MYLIP | 29116 | 220319_s_at | 0.0626 | 0.8418 | |
| GSE23400 | MYLIP | 29116 | 220319_s_at | -0.0056 | 0.9518 | |
| GSE26886 | MYLIP | 29116 | 228098_s_at | -0.7890 | 0.0640 | |
| GSE29001 | MYLIP | 29116 | 220319_s_at | -0.1047 | 0.7955 | |
| GSE38129 | MYLIP | 29116 | 220319_s_at | -0.0941 | 0.6631 | |
| GSE45670 | MYLIP | 29116 | 228098_s_at | -0.2017 | 0.6606 | |
| GSE53622 | MYLIP | 29116 | 75605 | -0.6352 | 0.0000 | |
| GSE53624 | MYLIP | 29116 | 75605 | -0.4531 | 0.0003 | |
| GSE63941 | MYLIP | 29116 | 228098_s_at | 1.4284 | 0.0760 | |
| GSE77861 | MYLIP | 29116 | 228098_s_at | -0.0599 | 0.9302 | |
| GSE97050 | MYLIP | 29116 | A_33_P3255914 | -1.0233 | 0.0680 | |
| SRP007169 | MYLIP | 29116 | RNAseq | 0.2612 | 0.5103 | |
| SRP008496 | MYLIP | 29116 | RNAseq | 0.0857 | 0.8206 | |
| SRP064894 | MYLIP | 29116 | RNAseq | -0.2950 | 0.2845 | |
| SRP133303 | MYLIP | 29116 | RNAseq | 0.0509 | 0.8915 | |
| SRP159526 | MYLIP | 29116 | RNAseq | 0.3101 | 0.3919 | |
| SRP193095 | MYLIP | 29116 | RNAseq | -0.2769 | 0.1928 | |
| SRP219564 | MYLIP | 29116 | RNAseq | -0.3123 | 0.5963 | |
| TCGA | MYLIP | 29116 | RNAseq | -0.2883 | 0.0249 |
Upregulated datasets: 0; Downregulated datasets: 0.
Survival by MYLIP expression:
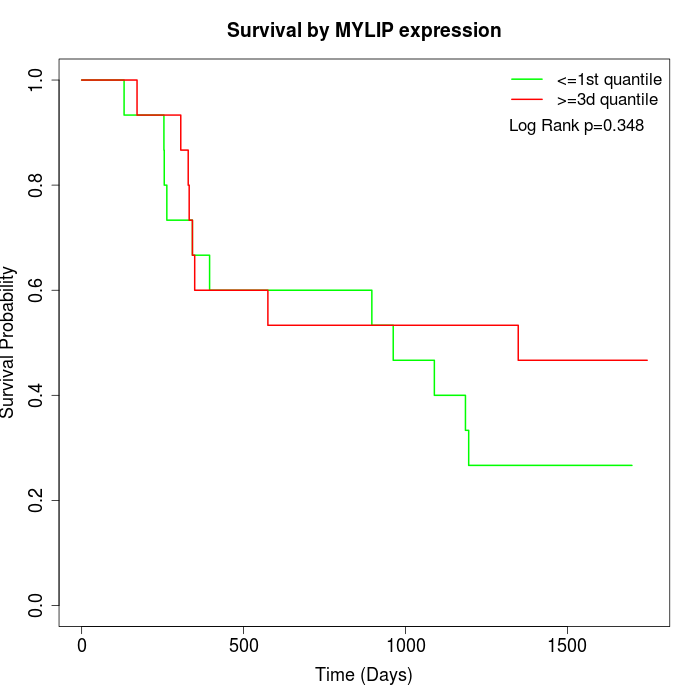 | 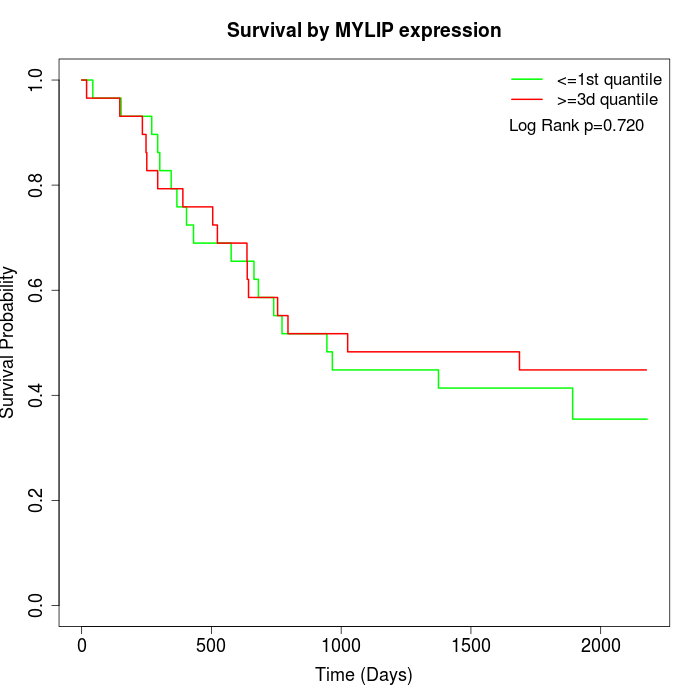 | 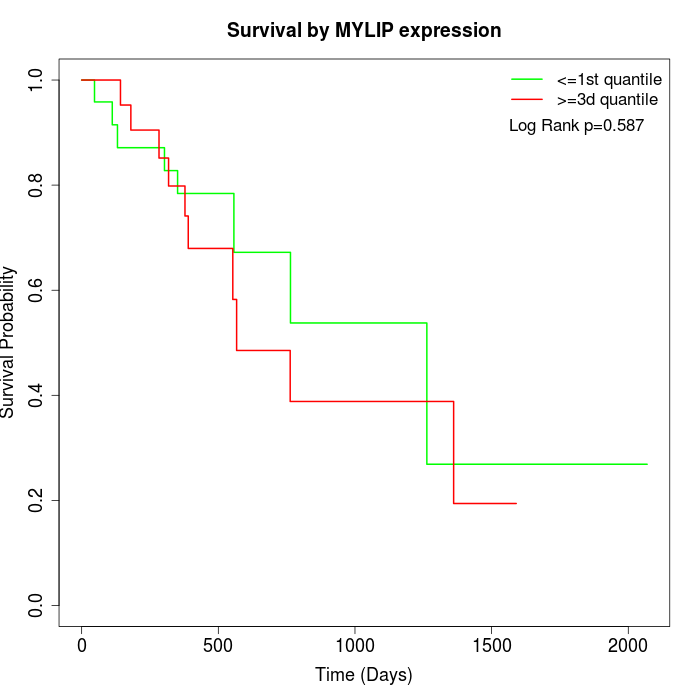 |
| GSE53622 | GSE53624 | TCGA |
Note: Click image to view full size file.
Copy number change of MYLIP:
| Dataset | Gene | EntrezID | Gain | Loss | Normal | Detail |
|---|---|---|---|---|---|---|
| GSE15526 | MYLIP | 29116 | 3 | 6 | 21 | |
| GSE20123 | MYLIP | 29116 | 3 | 5 | 22 | |
| GSE43470 | MYLIP | 29116 | 8 | 0 | 35 | |
| GSE46452 | MYLIP | 29116 | 1 | 10 | 48 | |
| GSE47630 | MYLIP | 29116 | 7 | 7 | 26 | |
| GSE54993 | MYLIP | 29116 | 1 | 1 | 68 | |
| GSE54994 | MYLIP | 29116 | 10 | 3 | 40 | |
| GSE60625 | MYLIP | 29116 | 0 | 1 | 10 | |
| GSE74703 | MYLIP | 29116 | 7 | 0 | 29 | |
| GSE74704 | MYLIP | 29116 | 2 | 2 | 16 | |
| TCGA | MYLIP | 29116 | 16 | 26 | 54 |
Total number of gains: 58; Total number of losses: 61; Total Number of normals: 369.
Somatic mutations of MYLIP:
Generating mutation plots.
Highly correlated genes for MYLIP:
Showing top 20/232 corelated genes with mean PCC>0.5.
| Gene1 | Gene2 | Mean PCC | Num. Datasets | Num. PCC<0 | Num. PCC>0.5 |
|---|---|---|---|---|---|
| MYLIP | ZNF529 | 0.794175 | 3 | 0 | 3 |
| MYLIP | WWP1 | 0.788535 | 3 | 0 | 3 |
| MYLIP | RPL38 | 0.785748 | 3 | 0 | 3 |
| MYLIP | NBN | 0.769047 | 3 | 0 | 3 |
| MYLIP | LYSMD1 | 0.768941 | 3 | 0 | 3 |
| MYLIP | IMMP1L | 0.758349 | 3 | 0 | 3 |
| MYLIP | ZNF419 | 0.748291 | 3 | 0 | 3 |
| MYLIP | USP11 | 0.748064 | 3 | 0 | 3 |
| MYLIP | ZNF208 | 0.733145 | 3 | 0 | 3 |
| MYLIP | TNRC6B | 0.731031 | 3 | 0 | 3 |
| MYLIP | PGRMC1 | 0.729057 | 3 | 0 | 3 |
| MYLIP | TMEM219 | 0.710961 | 3 | 0 | 3 |
| MYLIP | ANKRD46 | 0.71034 | 3 | 0 | 3 |
| MYLIP | TTC14 | 0.700596 | 3 | 0 | 3 |
| MYLIP | CCDC127 | 0.700057 | 3 | 0 | 3 |
| MYLIP | MAP1S | 0.696122 | 3 | 0 | 3 |
| MYLIP | GPR107 | 0.681737 | 3 | 0 | 3 |
| MYLIP | C5orf51 | 0.678223 | 3 | 0 | 3 |
| MYLIP | DCAF6 | 0.67697 | 3 | 0 | 3 |
| MYLIP | ADAR | 0.673825 | 3 | 0 | 3 |
For details and further investigation, click here