| Full name: NEDD4 binding protein 2 like 2 | Alias Symbol: CG005|PFAAP5 | ||
| Type: protein-coding gene | Cytoband: 13q13.1 | ||
| Entrez ID: 10443 | HGNC ID: HGNC:26916 | Ensembl Gene: ENSG00000244754 | OMIM ID: 615788 |
Expression of N4BP2L2:
| Dataset | Gene | EntrezID | Probe | Log2FC | Adj.pValue | Expression |
|---|---|---|---|---|---|---|
| GSE17351 | N4BP2L2 | 10443 | 202258_s_at | -0.5633 | 0.2838 | |
| GSE20347 | N4BP2L2 | 10443 | 221899_at | -0.1296 | 0.5531 | |
| GSE23400 | N4BP2L2 | 10443 | 221899_at | -0.1186 | 0.2156 | |
| GSE26886 | N4BP2L2 | 10443 | 202258_s_at | 0.0435 | 0.8903 | |
| GSE29001 | N4BP2L2 | 10443 | 221899_at | -0.1872 | 0.5233 | |
| GSE38129 | N4BP2L2 | 10443 | 202258_s_at | -0.3448 | 0.0033 | |
| GSE45670 | N4BP2L2 | 10443 | 221899_at | -0.2676 | 0.1248 | |
| GSE53622 | N4BP2L2 | 10443 | 64684 | -0.3070 | 0.0002 | |
| GSE53624 | N4BP2L2 | 10443 | 64684 | -0.2653 | 0.0000 | |
| GSE63941 | N4BP2L2 | 10443 | 202258_s_at | 0.4990 | 0.2483 | |
| GSE77861 | N4BP2L2 | 10443 | 202258_s_at | -0.2578 | 0.3993 | |
| GSE97050 | N4BP2L2 | 10443 | A_23_P53856 | -0.4813 | 0.1076 | |
| SRP007169 | N4BP2L2 | 10443 | RNAseq | -0.6659 | 0.0486 | |
| SRP008496 | N4BP2L2 | 10443 | RNAseq | -0.4020 | 0.0512 | |
| SRP064894 | N4BP2L2 | 10443 | RNAseq | -0.1303 | 0.3782 | |
| SRP133303 | N4BP2L2 | 10443 | RNAseq | -0.3545 | 0.0258 | |
| SRP159526 | N4BP2L2 | 10443 | RNAseq | -0.6544 | 0.0201 | |
| SRP193095 | N4BP2L2 | 10443 | RNAseq | -0.3637 | 0.0004 | |
| SRP219564 | N4BP2L2 | 10443 | RNAseq | -0.5752 | 0.0616 | |
| TCGA | N4BP2L2 | 10443 | RNAseq | -0.1930 | 0.0001 |
Upregulated datasets: 0; Downregulated datasets: 0.
Survival by N4BP2L2 expression:
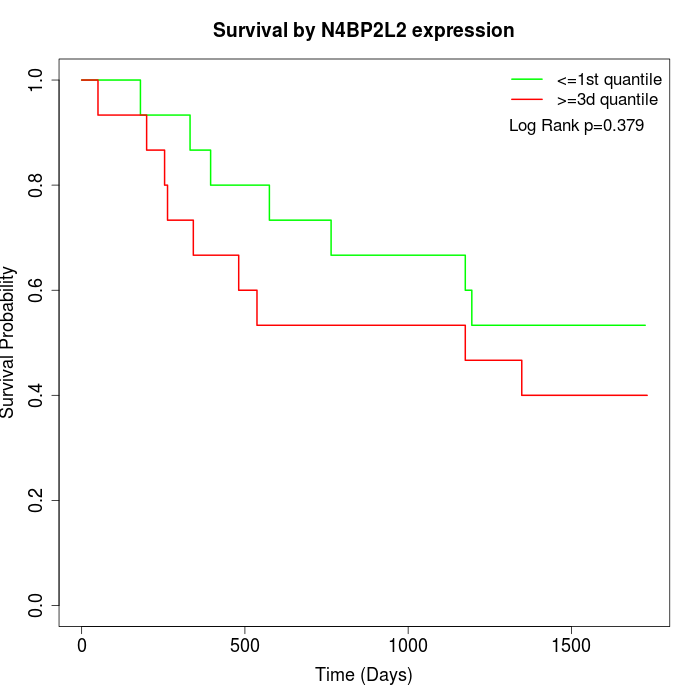 | 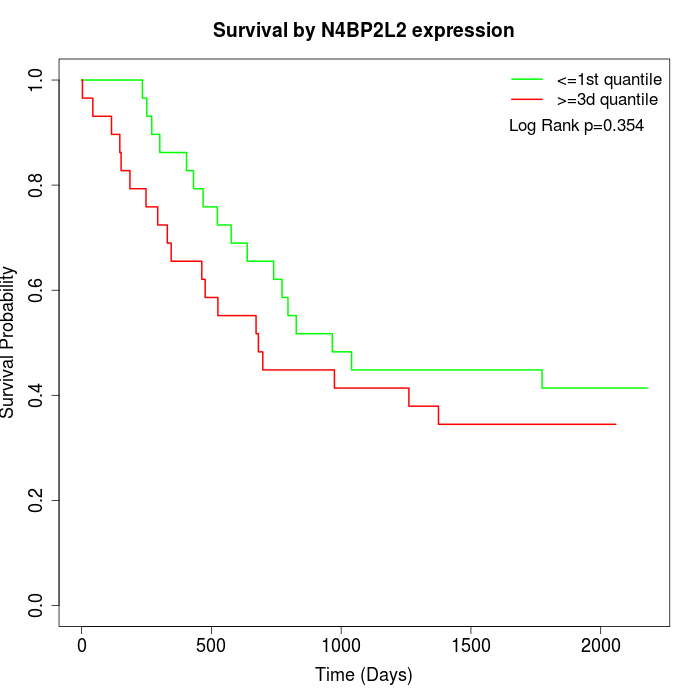 | 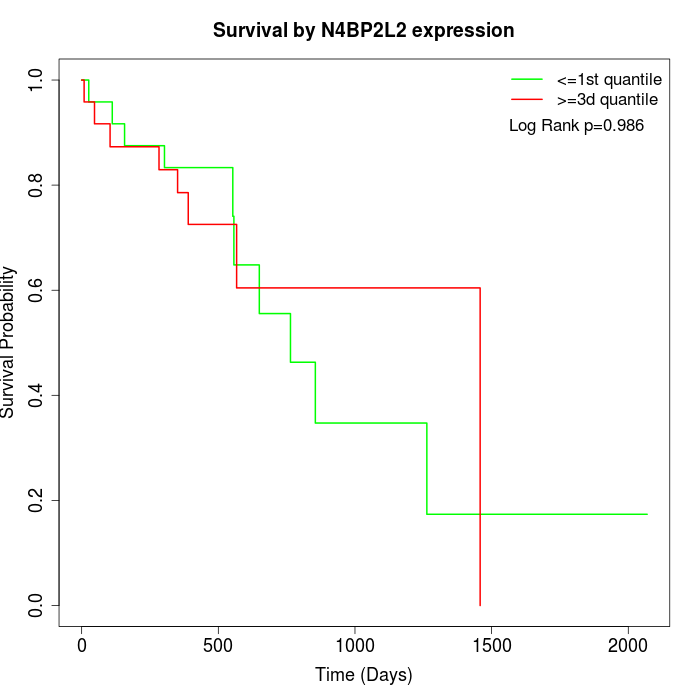 |
| GSE53622 | GSE53624 | TCGA |
Note: Click image to view full size file.
Copy number change of N4BP2L2:
| Dataset | Gene | EntrezID | Gain | Loss | Normal | Detail |
|---|---|---|---|---|---|---|
| GSE15526 | N4BP2L2 | 10443 | 1 | 15 | 14 | |
| GSE20123 | N4BP2L2 | 10443 | 1 | 14 | 15 | |
| GSE43470 | N4BP2L2 | 10443 | 2 | 13 | 28 | |
| GSE46452 | N4BP2L2 | 10443 | 0 | 33 | 26 | |
| GSE47630 | N4BP2L2 | 10443 | 2 | 27 | 11 | |
| GSE54993 | N4BP2L2 | 10443 | 12 | 2 | 56 | |
| GSE54994 | N4BP2L2 | 10443 | 2 | 15 | 36 | |
| GSE60625 | N4BP2L2 | 10443 | 0 | 3 | 8 | |
| GSE74703 | N4BP2L2 | 10443 | 2 | 10 | 24 | |
| GSE74704 | N4BP2L2 | 10443 | 0 | 12 | 8 | |
| TCGA | N4BP2L2 | 10443 | 8 | 37 | 51 |
Total number of gains: 30; Total number of losses: 181; Total Number of normals: 277.
Somatic mutations of N4BP2L2:
Generating mutation plots.
Highly correlated genes for N4BP2L2:
Showing top 20/354 corelated genes with mean PCC>0.5.
| Gene1 | Gene2 | Mean PCC | Num. Datasets | Num. PCC<0 | Num. PCC>0.5 |
|---|---|---|---|---|---|
| N4BP2L2 | RNF135 | 0.79358 | 3 | 0 | 3 |
| N4BP2L2 | CYYR1 | 0.779338 | 3 | 0 | 3 |
| N4BP2L2 | DIS3L | 0.753228 | 3 | 0 | 3 |
| N4BP2L2 | ASXL1 | 0.7488 | 3 | 0 | 3 |
| N4BP2L2 | ZBTB43 | 0.745995 | 3 | 0 | 3 |
| N4BP2L2 | GATAD1 | 0.729753 | 3 | 0 | 3 |
| N4BP2L2 | IPO8 | 0.723586 | 4 | 0 | 4 |
| N4BP2L2 | SLC35D2 | 0.720594 | 4 | 0 | 4 |
| N4BP2L2 | TBRG1 | 0.718836 | 3 | 0 | 3 |
| N4BP2L2 | SUGP2 | 0.716247 | 3 | 0 | 3 |
| N4BP2L2 | RPS11 | 0.715943 | 3 | 0 | 3 |
| N4BP2L2 | FBXO9 | 0.7113 | 4 | 0 | 3 |
| N4BP2L2 | CREBRF | 0.703993 | 4 | 0 | 4 |
| N4BP2L2 | UTP14C | 0.697568 | 3 | 0 | 3 |
| N4BP2L2 | ZNF565 | 0.696889 | 5 | 0 | 4 |
| N4BP2L2 | UBE2G1 | 0.691046 | 4 | 0 | 3 |
| N4BP2L2 | SENP7 | 0.682873 | 3 | 0 | 3 |
| N4BP2L2 | IDE | 0.680794 | 3 | 0 | 3 |
| N4BP2L2 | ZNF383 | 0.680351 | 5 | 0 | 4 |
| N4BP2L2 | RNF115 | 0.679178 | 4 | 0 | 3 |
For details and further investigation, click here