| Full name: zinc finger and BTB domain containing 43 | Alias Symbol: KIAA0414|ZNF-X|FLJ22470|ZBTB22B | ||
| Type: protein-coding gene | Cytoband: 9q33.3 | ||
| Entrez ID: 23099 | HGNC ID: HGNC:17908 | Ensembl Gene: ENSG00000169155 | OMIM ID: |
Expression of ZBTB43:
| Dataset | Gene | EntrezID | Probe | Log2FC | Adj.pValue | Expression |
|---|---|---|---|---|---|---|
| GSE17351 | ZBTB43 | 23099 | 204181_s_at | -0.3755 | 0.5155 | |
| GSE20347 | ZBTB43 | 23099 | 204181_s_at | -0.6462 | 0.0000 | |
| GSE23400 | ZBTB43 | 23099 | 204181_s_at | -0.1635 | 0.0033 | |
| GSE26886 | ZBTB43 | 23099 | 204181_s_at | -0.5706 | 0.0128 | |
| GSE29001 | ZBTB43 | 23099 | 204181_s_at | -0.6306 | 0.0321 | |
| GSE38129 | ZBTB43 | 23099 | 204181_s_at | -0.4251 | 0.0089 | |
| GSE45670 | ZBTB43 | 23099 | 227991_x_at | -0.1873 | 0.2458 | |
| GSE53622 | ZBTB43 | 23099 | 71145 | -0.4830 | 0.0000 | |
| GSE53624 | ZBTB43 | 23099 | 71145 | -0.3725 | 0.0000 | |
| GSE63941 | ZBTB43 | 23099 | 227991_x_at | -0.4448 | 0.2762 | |
| GSE77861 | ZBTB43 | 23099 | 227991_x_at | -0.0614 | 0.8071 | |
| GSE97050 | ZBTB43 | 23099 | A_33_P3349414 | -0.7401 | 0.0781 | |
| SRP007169 | ZBTB43 | 23099 | RNAseq | -0.0937 | 0.8437 | |
| SRP008496 | ZBTB43 | 23099 | RNAseq | 0.0436 | 0.8783 | |
| SRP064894 | ZBTB43 | 23099 | RNAseq | -0.8046 | 0.0047 | |
| SRP133303 | ZBTB43 | 23099 | RNAseq | -0.2518 | 0.2320 | |
| SRP159526 | ZBTB43 | 23099 | RNAseq | -0.6453 | 0.0091 | |
| SRP193095 | ZBTB43 | 23099 | RNAseq | -0.4238 | 0.0004 | |
| SRP219564 | ZBTB43 | 23099 | RNAseq | -0.0655 | 0.9015 | |
| TCGA | ZBTB43 | 23099 | RNAseq | -0.0911 | 0.1749 |
Upregulated datasets: 0; Downregulated datasets: 0.
Survival by ZBTB43 expression:
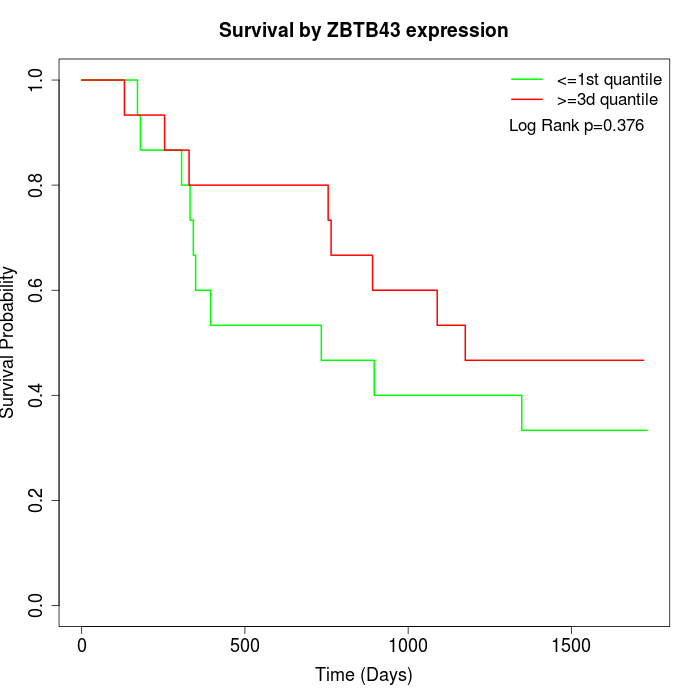 |  |  |
| GSE53622 | GSE53624 | TCGA |
Note: Click image to view full size file.
Copy number change of ZBTB43:
| Dataset | Gene | EntrezID | Gain | Loss | Normal | Detail |
|---|---|---|---|---|---|---|
| GSE15526 | ZBTB43 | 23099 | 6 | 9 | 15 | |
| GSE20123 | ZBTB43 | 23099 | 6 | 9 | 15 | |
| GSE43470 | ZBTB43 | 23099 | 7 | 5 | 31 | |
| GSE46452 | ZBTB43 | 23099 | 6 | 13 | 40 | |
| GSE47630 | ZBTB43 | 23099 | 3 | 16 | 21 | |
| GSE54993 | ZBTB43 | 23099 | 3 | 3 | 64 | |
| GSE54994 | ZBTB43 | 23099 | 12 | 8 | 33 | |
| GSE60625 | ZBTB43 | 23099 | 0 | 0 | 11 | |
| GSE74703 | ZBTB43 | 23099 | 6 | 3 | 27 | |
| GSE74704 | ZBTB43 | 23099 | 3 | 7 | 10 | |
| TCGA | ZBTB43 | 23099 | 27 | 25 | 44 |
Total number of gains: 79; Total number of losses: 98; Total Number of normals: 311.
Somatic mutations of ZBTB43:
Generating mutation plots.
Highly correlated genes for ZBTB43:
Showing top 20/960 corelated genes with mean PCC>0.5.
| Gene1 | Gene2 | Mean PCC | Num. Datasets | Num. PCC<0 | Num. PCC>0.5 |
|---|---|---|---|---|---|
| ZBTB43 | AKAP17A | 0.766896 | 3 | 0 | 3 |
| ZBTB43 | PITHD1 | 0.754384 | 3 | 0 | 3 |
| ZBTB43 | N4BP2L2 | 0.745995 | 3 | 0 | 3 |
| ZBTB43 | TDRD3 | 0.735563 | 4 | 0 | 4 |
| ZBTB43 | AP1B1 | 0.734454 | 4 | 0 | 4 |
| ZBTB43 | TBRG1 | 0.72847 | 3 | 0 | 3 |
| ZBTB43 | ULK3 | 0.718351 | 3 | 0 | 3 |
| ZBTB43 | RPL14 | 0.713754 | 4 | 0 | 3 |
| ZBTB43 | LYSMD3 | 0.70453 | 3 | 0 | 3 |
| ZBTB43 | NKTR | 0.703548 | 5 | 0 | 5 |
| ZBTB43 | ZNF292 | 0.700505 | 4 | 0 | 4 |
| ZBTB43 | PAIP2 | 0.698521 | 3 | 0 | 3 |
| ZBTB43 | TRAPPC6B | 0.698019 | 3 | 0 | 3 |
| ZBTB43 | RAB14 | 0.696007 | 10 | 0 | 10 |
| ZBTB43 | DGCR2 | 0.693211 | 3 | 0 | 3 |
| ZBTB43 | FRMD4B | 0.693113 | 7 | 0 | 7 |
| ZBTB43 | CCDC12 | 0.693023 | 4 | 0 | 3 |
| ZBTB43 | CCNT1 | 0.691538 | 3 | 0 | 3 |
| ZBTB43 | RASA1 | 0.69089 | 3 | 0 | 3 |
| ZBTB43 | ANKRD13A | 0.68847 | 3 | 0 | 3 |
For details and further investigation, click here