| Full name: F-box protein 9 | Alias Symbol: FBX9|NY-REN-57 | ||
| Type: protein-coding gene | Cytoband: 6p12.1 | ||
| Entrez ID: 26268 | HGNC ID: HGNC:13588 | Ensembl Gene: ENSG00000112146 | OMIM ID: 609091 |
Expression of FBXO9:
| Dataset | Gene | EntrezID | Probe | Log2FC | Adj.pValue | Expression |
|---|---|---|---|---|---|---|
| GSE17351 | FBXO9 | 26268 | 212987_at | -0.4213 | 0.4445 | |
| GSE20347 | FBXO9 | 26268 | 212987_at | -0.4360 | 0.0037 | |
| GSE23400 | FBXO9 | 26268 | 210638_s_at | -0.0750 | 0.2533 | |
| GSE26886 | FBXO9 | 26268 | 212987_at | -1.5358 | 0.0000 | |
| GSE29001 | FBXO9 | 26268 | 212987_at | -0.1343 | 0.6122 | |
| GSE38129 | FBXO9 | 26268 | 212987_at | -0.5056 | 0.0001 | |
| GSE45670 | FBXO9 | 26268 | 212987_at | -0.3293 | 0.0048 | |
| GSE53622 | FBXO9 | 26268 | 11525 | -0.4949 | 0.0000 | |
| GSE53624 | FBXO9 | 26268 | 11525 | -0.3598 | 0.0000 | |
| GSE63941 | FBXO9 | 26268 | 210638_s_at | -0.3413 | 0.3760 | |
| GSE77861 | FBXO9 | 26268 | 212987_at | -0.0855 | 0.8859 | |
| GSE97050 | FBXO9 | 26268 | A_23_P254120 | -0.3530 | 0.3248 | |
| SRP007169 | FBXO9 | 26268 | RNAseq | -0.9137 | 0.0073 | |
| SRP008496 | FBXO9 | 26268 | RNAseq | -0.8008 | 0.0000 | |
| SRP064894 | FBXO9 | 26268 | RNAseq | -0.3825 | 0.0033 | |
| SRP133303 | FBXO9 | 26268 | RNAseq | -0.2847 | 0.0275 | |
| SRP159526 | FBXO9 | 26268 | RNAseq | -0.2916 | 0.0923 | |
| SRP193095 | FBXO9 | 26268 | RNAseq | -0.4115 | 0.0000 | |
| SRP219564 | FBXO9 | 26268 | RNAseq | -0.0577 | 0.8963 | |
| TCGA | FBXO9 | 26268 | RNAseq | -0.2657 | 0.0000 |
Upregulated datasets: 0; Downregulated datasets: 1.
Survival by FBXO9 expression:
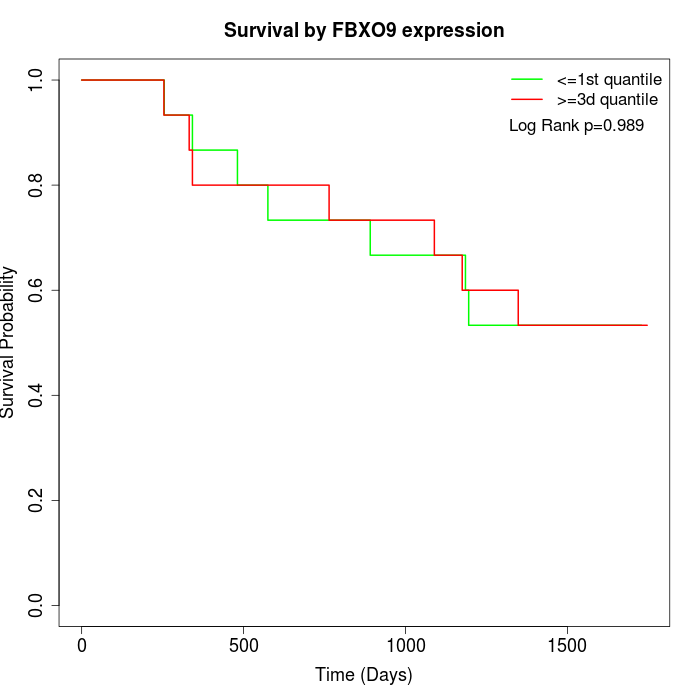 | 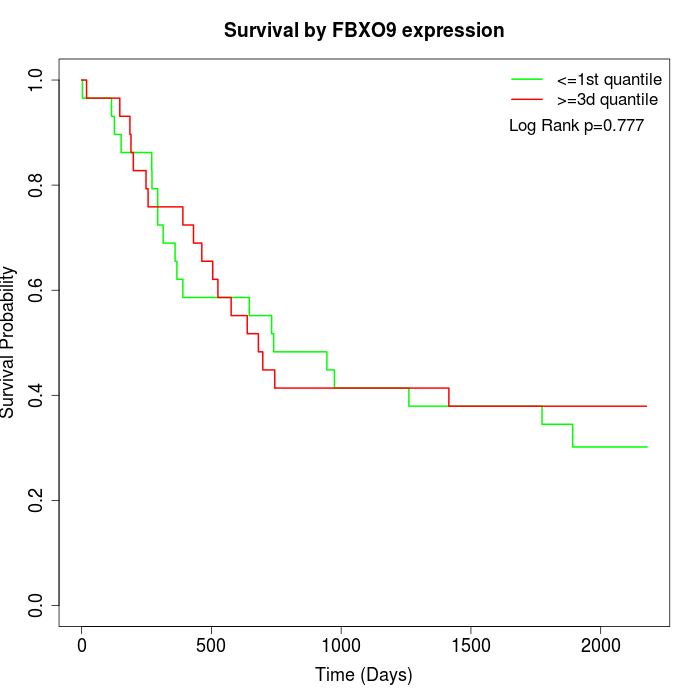 | 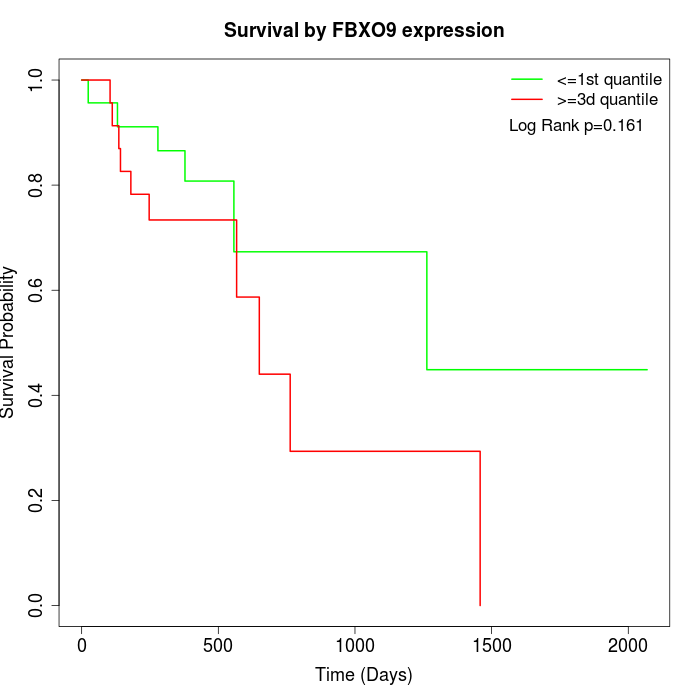 |
| GSE53622 | GSE53624 | TCGA |
Note: Click image to view full size file.
Copy number change of FBXO9:
| Dataset | Gene | EntrezID | Gain | Loss | Normal | Detail |
|---|---|---|---|---|---|---|
| GSE15526 | FBXO9 | 26268 | 6 | 3 | 21 | |
| GSE20123 | FBXO9 | 26268 | 7 | 2 | 21 | |
| GSE43470 | FBXO9 | 26268 | 5 | 0 | 38 | |
| GSE46452 | FBXO9 | 26268 | 2 | 10 | 47 | |
| GSE47630 | FBXO9 | 26268 | 7 | 5 | 28 | |
| GSE54993 | FBXO9 | 26268 | 3 | 1 | 66 | |
| GSE54994 | FBXO9 | 26268 | 8 | 4 | 41 | |
| GSE60625 | FBXO9 | 26268 | 0 | 3 | 8 | |
| GSE74703 | FBXO9 | 26268 | 5 | 0 | 31 | |
| GSE74704 | FBXO9 | 26268 | 3 | 1 | 16 | |
| TCGA | FBXO9 | 26268 | 22 | 12 | 62 |
Total number of gains: 68; Total number of losses: 41; Total Number of normals: 379.
Somatic mutations of FBXO9:
Generating mutation plots.
Highly correlated genes for FBXO9:
Showing top 20/847 corelated genes with mean PCC>0.5.
| Gene1 | Gene2 | Mean PCC | Num. Datasets | Num. PCC<0 | Num. PCC>0.5 |
|---|---|---|---|---|---|
| FBXO9 | HDHD2 | 0.858795 | 4 | 0 | 4 |
| FBXO9 | EPB41 | 0.820181 | 3 | 0 | 3 |
| FBXO9 | USP9Y | 0.783361 | 3 | 0 | 3 |
| FBXO9 | RBM7 | 0.769509 | 3 | 0 | 3 |
| FBXO9 | OXNAD1 | 0.750471 | 4 | 0 | 4 |
| FBXO9 | GUF1 | 0.750302 | 3 | 0 | 3 |
| FBXO9 | CHCHD4 | 0.748814 | 3 | 0 | 3 |
| FBXO9 | TUBE1 | 0.733279 | 3 | 0 | 3 |
| FBXO9 | BRK1 | 0.732105 | 4 | 0 | 4 |
| FBXO9 | STT3B | 0.729417 | 3 | 0 | 3 |
| FBXO9 | ZMAT1 | 0.725914 | 4 | 0 | 3 |
| FBXO9 | PCMTD1 | 0.72546 | 5 | 0 | 5 |
| FBXO9 | CRBN | 0.724852 | 6 | 0 | 6 |
| FBXO9 | MACROD2 | 0.724076 | 3 | 0 | 3 |
| FBXO9 | DCAF8 | 0.72151 | 4 | 0 | 4 |
| FBXO9 | CLK1 | 0.716178 | 4 | 0 | 4 |
| FBXO9 | METAP1 | 0.713134 | 4 | 0 | 4 |
| FBXO9 | N4BP2L2 | 0.7113 | 4 | 0 | 3 |
| FBXO9 | PAIP2 | 0.708673 | 4 | 0 | 3 |
| FBXO9 | CDC40 | 0.70626 | 3 | 0 | 3 |
For details and further investigation, click here