| Full name: pancreatic and duodenal homeobox 1 | Alias Symbol: IDX-1|STF-1|PDX-1|MODY4 | ||
| Type: protein-coding gene | Cytoband: 13q12.2 | ||
| Entrez ID: 3651 | HGNC ID: HGNC:6107 | Ensembl Gene: ENSG00000139515 | OMIM ID: 600733 |
PDX1 involved pathways:
| KEGG pathway | Description | View |
|---|---|---|
| hsa04911 | Insulin secretion | |
| hsa04930 | Type II diabetes mellitus | |
| hsa04950 | Maturity onset diabetes of the young |
Expression of PDX1:
| Dataset | Gene | EntrezID | Probe | Log2FC | Adj.pValue | Expression |
|---|---|---|---|---|---|---|
| GSE17351 | PDX1 | 3651 | 208559_at | 0.0350 | 0.9176 | |
| GSE20347 | PDX1 | 3651 | 208559_at | 0.0519 | 0.4301 | |
| GSE23400 | PDX1 | 3651 | 210938_at | -0.0840 | 0.0029 | |
| GSE26886 | PDX1 | 3651 | 208559_at | 0.0900 | 0.4072 | |
| GSE29001 | PDX1 | 3651 | 210938_at | -0.1800 | 0.1736 | |
| GSE38129 | PDX1 | 3651 | 208559_at | -0.0177 | 0.8196 | |
| GSE45670 | PDX1 | 3651 | 208559_at | 0.0407 | 0.6660 | |
| GSE53622 | PDX1 | 3651 | 77352 | 0.2380 | 0.2520 | |
| GSE53624 | PDX1 | 3651 | 77352 | -0.1368 | 0.2060 | |
| GSE63941 | PDX1 | 3651 | 208559_at | 0.0252 | 0.8998 | |
| GSE77861 | PDX1 | 3651 | 208559_at | -0.0620 | 0.6585 | |
| TCGA | PDX1 | 3651 | RNAseq | -1.8500 | 0.0148 |
Upregulated datasets: 0; Downregulated datasets: 1.
Survival by PDX1 expression:
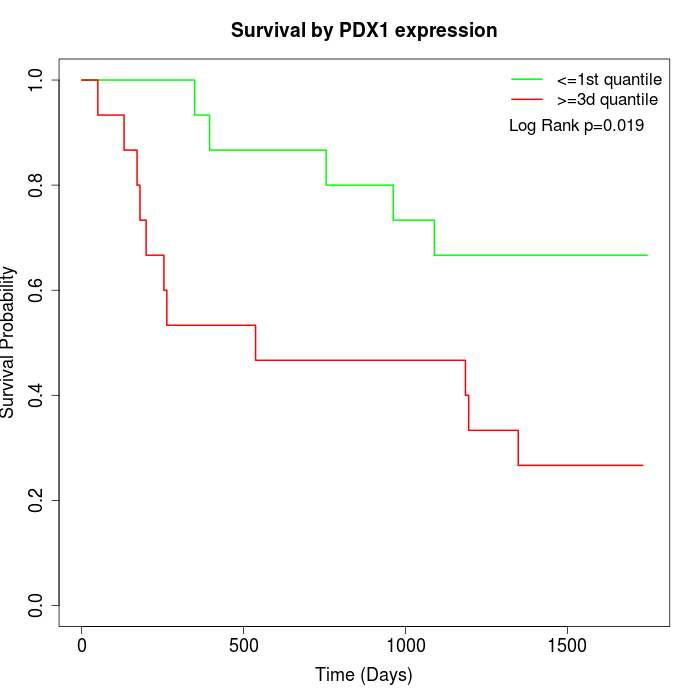 | 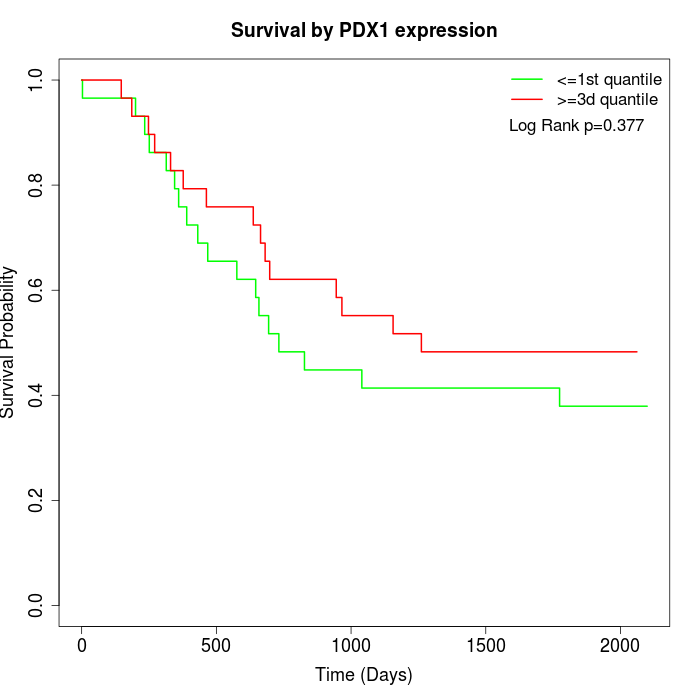 | 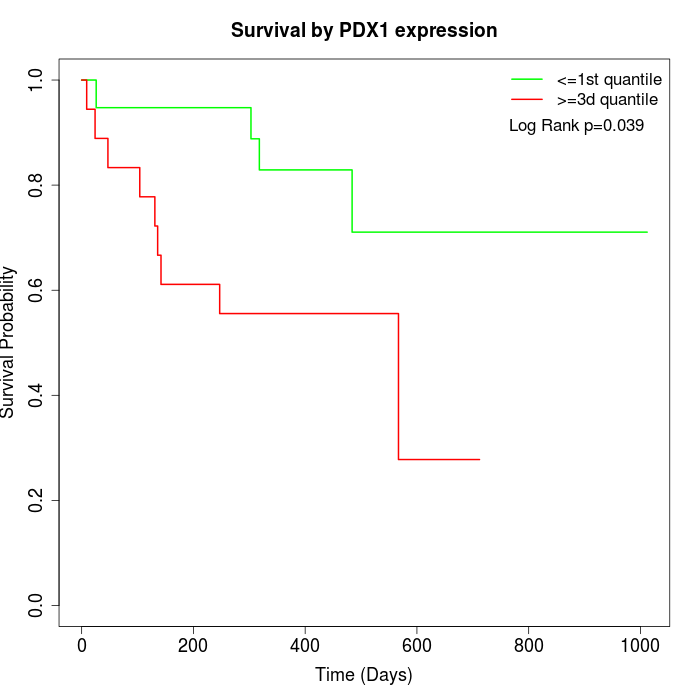 |
| GSE53622 | GSE53624 | TCGA |
Note: Click image to view full size file.
Copy number change of PDX1:
| Dataset | Gene | EntrezID | Gain | Loss | Normal | Detail |
|---|---|---|---|---|---|---|
| GSE15526 | PDX1 | 3651 | 1 | 14 | 15 | |
| GSE20123 | PDX1 | 3651 | 1 | 12 | 17 | |
| GSE43470 | PDX1 | 3651 | 2 | 12 | 29 | |
| GSE46452 | PDX1 | 3651 | 0 | 33 | 26 | |
| GSE47630 | PDX1 | 3651 | 3 | 26 | 11 | |
| GSE54993 | PDX1 | 3651 | 11 | 2 | 57 | |
| GSE54994 | PDX1 | 3651 | 1 | 13 | 39 | |
| GSE60625 | PDX1 | 3651 | 0 | 3 | 8 | |
| GSE74703 | PDX1 | 3651 | 2 | 9 | 25 | |
| GSE74704 | PDX1 | 3651 | 0 | 10 | 10 | |
| TCGA | PDX1 | 3651 | 7 | 39 | 50 |
Total number of gains: 28; Total number of losses: 173; Total Number of normals: 287.
Somatic mutations of PDX1:
Generating mutation plots.
Highly correlated genes for PDX1:
Showing top 20/787 corelated genes with mean PCC>0.5.
| Gene1 | Gene2 | Mean PCC | Num. Datasets | Num. PCC<0 | Num. PCC>0.5 |
|---|---|---|---|---|---|
| PDX1 | RUNX2 | 0.677136 | 4 | 0 | 4 |
| PDX1 | BTNL8 | 0.671478 | 5 | 0 | 4 |
| PDX1 | SFRP5 | 0.670137 | 3 | 0 | 3 |
| PDX1 | C11orf16 | 0.665282 | 7 | 0 | 7 |
| PDX1 | SHCBP1L | 0.658929 | 4 | 0 | 3 |
| PDX1 | GRIN1 | 0.65888 | 7 | 0 | 6 |
| PDX1 | MPO | 0.652912 | 4 | 0 | 3 |
| PDX1 | UTF1 | 0.65047 | 4 | 0 | 4 |
| PDX1 | OVGP1 | 0.647361 | 3 | 0 | 3 |
| PDX1 | NAT2 | 0.646453 | 4 | 0 | 3 |
| PDX1 | IL1RAPL2 | 0.641678 | 5 | 0 | 4 |
| PDX1 | LINC00851 | 0.641195 | 4 | 0 | 4 |
| PDX1 | FN3K | 0.640966 | 4 | 0 | 4 |
| PDX1 | EDA2R | 0.637685 | 6 | 0 | 5 |
| PDX1 | PLG | 0.634485 | 4 | 0 | 4 |
| PDX1 | ADRB1 | 0.634044 | 4 | 0 | 4 |
| PDX1 | HPCA | 0.633215 | 6 | 0 | 5 |
| PDX1 | SLC5A11 | 0.631242 | 4 | 0 | 3 |
| PDX1 | CAMK1G | 0.63101 | 3 | 0 | 3 |
| PDX1 | IRS4 | 0.630032 | 5 | 0 | 4 |
For details and further investigation, click here