| Full name: phosphorylase kinase catalytic subunit gamma 1 | Alias Symbol: | ||
| Type: protein-coding gene | Cytoband: 7p11.2 | ||
| Entrez ID: 5260 | HGNC ID: HGNC:8930 | Ensembl Gene: ENSG00000164776 | OMIM ID: 172470 |
| Related drugs: A-443654... [more] | |||
PHKG1 involved pathways:
| KEGG pathway | Description | View |
|---|---|---|
| hsa04020 | Calcium signaling pathway | |
| hsa04910 | Insulin signaling pathway | |
| hsa04922 | Glucagon signaling pathway |
Expression of PHKG1:
| Dataset | Gene | EntrezID | Probe | Log2FC | Adj.pValue | Expression |
|---|---|---|---|---|---|---|
| GSE17351 | PHKG1 | 5260 | 207312_at | -0.1580 | 0.6678 | |
| GSE20347 | PHKG1 | 5260 | 207312_at | -0.0109 | 0.9137 | |
| GSE23400 | PHKG1 | 5260 | 207312_at | -0.1112 | 0.0042 | |
| GSE26886 | PHKG1 | 5260 | 207312_at | 0.3034 | 0.0256 | |
| GSE29001 | PHKG1 | 5260 | 207312_at | -0.0991 | 0.5774 | |
| GSE38129 | PHKG1 | 5260 | 207312_at | -0.0712 | 0.3468 | |
| GSE45670 | PHKG1 | 5260 | 207312_at | 0.0597 | 0.6131 | |
| GSE53622 | PHKG1 | 5260 | 55908 | -0.3321 | 0.0000 | |
| GSE53624 | PHKG1 | 5260 | 55908 | -0.4262 | 0.0000 | |
| GSE63941 | PHKG1 | 5260 | 207312_at | 0.5493 | 0.0091 | |
| GSE77861 | PHKG1 | 5260 | 207312_at | 0.0394 | 0.8046 | |
| GSE97050 | PHKG1 | 5260 | A_33_P3416479 | -0.1110 | 0.7508 | |
| SRP064894 | PHKG1 | 5260 | RNAseq | 0.7263 | 0.0200 | |
| SRP133303 | PHKG1 | 5260 | RNAseq | 0.2180 | 0.2925 | |
| SRP159526 | PHKG1 | 5260 | RNAseq | 0.6171 | 0.1371 | |
| SRP193095 | PHKG1 | 5260 | RNAseq | 0.5415 | 0.0053 | |
| SRP219564 | PHKG1 | 5260 | RNAseq | 0.3320 | 0.5388 | |
| TCGA | PHKG1 | 5260 | RNAseq | -0.2110 | 0.5482 |
Upregulated datasets: 0; Downregulated datasets: 0.
Survival by PHKG1 expression:
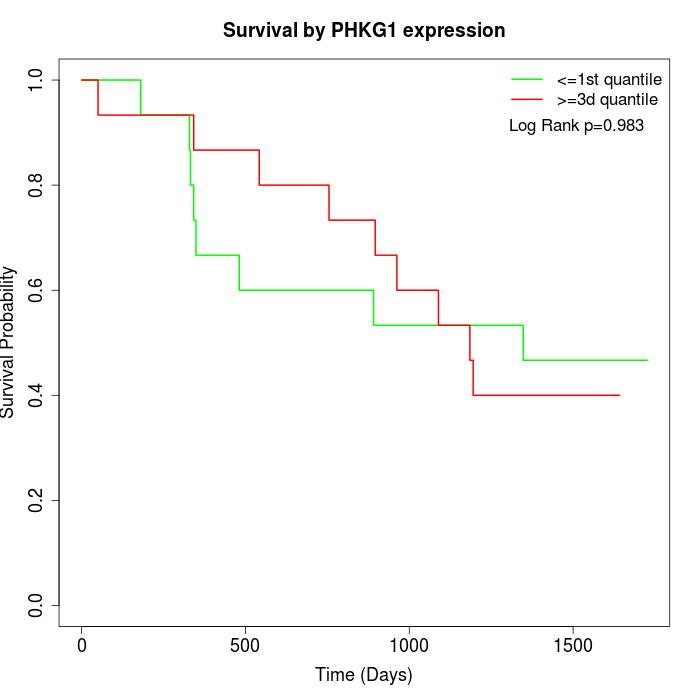 | 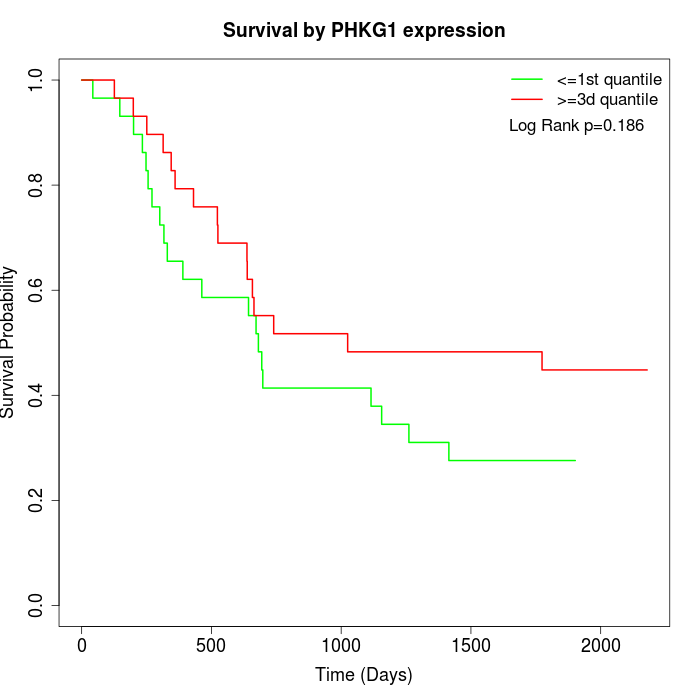 | 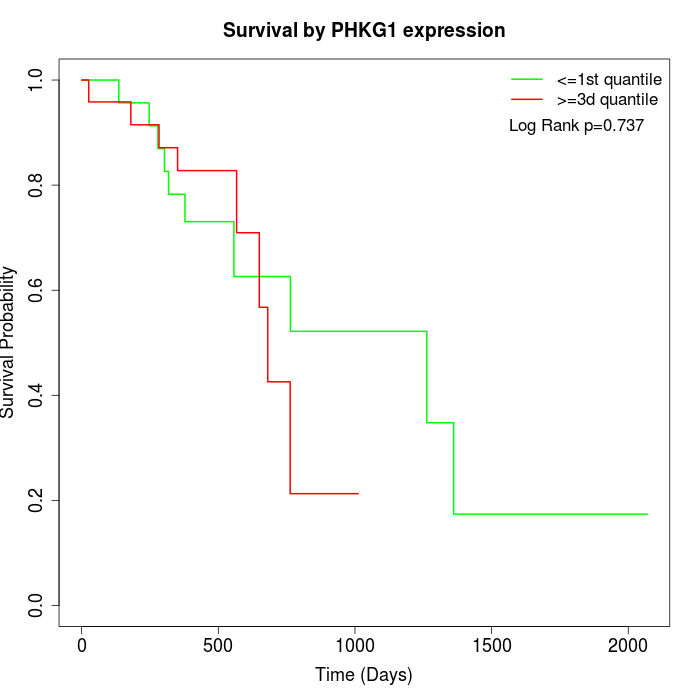 |
| GSE53622 | GSE53624 | TCGA |
Note: Click image to view full size file.
Copy number change of PHKG1:
| Dataset | Gene | EntrezID | Gain | Loss | Normal | Detail |
|---|---|---|---|---|---|---|
| GSE15526 | PHKG1 | 5260 | 13 | 0 | 17 | |
| GSE20123 | PHKG1 | 5260 | 11 | 0 | 19 | |
| GSE43470 | PHKG1 | 5260 | 5 | 0 | 38 | |
| GSE46452 | PHKG1 | 5260 | 13 | 0 | 46 | |
| GSE47630 | PHKG1 | 5260 | 10 | 1 | 29 | |
| GSE54993 | PHKG1 | 5260 | 0 | 8 | 62 | |
| GSE54994 | PHKG1 | 5260 | 16 | 2 | 35 | |
| GSE60625 | PHKG1 | 5260 | 0 | 0 | 11 | |
| GSE74703 | PHKG1 | 5260 | 5 | 0 | 31 | |
| GSE74704 | PHKG1 | 5260 | 6 | 0 | 14 | |
| TCGA | PHKG1 | 5260 | 53 | 5 | 38 |
Total number of gains: 132; Total number of losses: 16; Total Number of normals: 340.
Somatic mutations of PHKG1:
Generating mutation plots.
Highly correlated genes for PHKG1:
Showing top 20/449 corelated genes with mean PCC>0.5.
| Gene1 | Gene2 | Mean PCC | Num. Datasets | Num. PCC<0 | Num. PCC>0.5 |
|---|---|---|---|---|---|
| PHKG1 | KRTAP5-10 | 0.727337 | 3 | 0 | 3 |
| PHKG1 | SSPO | 0.725513 | 3 | 0 | 3 |
| PHKG1 | BARHL2 | 0.700316 | 3 | 0 | 3 |
| PHKG1 | ALPL | 0.680981 | 4 | 0 | 4 |
| PHKG1 | EXD3 | 0.657486 | 3 | 0 | 3 |
| PHKG1 | MNX1-AS1 | 0.650956 | 3 | 0 | 3 |
| PHKG1 | ZNF483 | 0.648887 | 3 | 0 | 3 |
| PHKG1 | RHAG | 0.648875 | 4 | 0 | 3 |
| PHKG1 | ADAD2 | 0.64749 | 4 | 0 | 3 |
| PHKG1 | TAC3 | 0.647113 | 5 | 0 | 4 |
| PHKG1 | OR7C2 | 0.646065 | 3 | 0 | 3 |
| PHKG1 | HTR5A | 0.643823 | 4 | 0 | 3 |
| PHKG1 | PELI3 | 0.638448 | 3 | 0 | 3 |
| PHKG1 | OR2H2 | 0.635688 | 7 | 0 | 7 |
| PHKG1 | FGF18 | 0.634364 | 6 | 0 | 5 |
| PHKG1 | ASPDH | 0.631383 | 3 | 0 | 3 |
| PHKG1 | MOGAT2 | 0.629637 | 6 | 0 | 4 |
| PHKG1 | DRP2 | 0.626466 | 4 | 0 | 3 |
| PHKG1 | HTR1E | 0.626296 | 5 | 0 | 3 |
| PHKG1 | TMEM145 | 0.626112 | 3 | 0 | 3 |
For details and further investigation, click here