| Full name: phosphatidylinositol glycan anchor biosynthesis class S | Alias Symbol: | ||
| Type: protein-coding gene | Cytoband: 17q11.2 | ||
| Entrez ID: 94005 | HGNC ID: HGNC:14937 | Ensembl Gene: ENSG00000087111 | OMIM ID: 610271 |
Expression of PIGS:
| Dataset | Gene | EntrezID | Probe | Log2FC | Adj.pValue | Expression |
|---|---|---|---|---|---|---|
| GSE17351 | PIGS | 94005 | 223148_at | 0.0425 | 0.9280 | |
| GSE26886 | PIGS | 94005 | 223148_at | 0.0428 | 0.8457 | |
| GSE45670 | PIGS | 94005 | 223148_at | 0.2442 | 0.0268 | |
| GSE53622 | PIGS | 94005 | 26848 | 0.0039 | 0.9517 | |
| GSE53624 | PIGS | 94005 | 26848 | 0.1256 | 0.0225 | |
| GSE63941 | PIGS | 94005 | 223148_at | 0.1979 | 0.6951 | |
| GSE77861 | PIGS | 94005 | 223148_at | 0.3168 | 0.1241 | |
| GSE97050 | PIGS | 94005 | A_23_P66715 | 0.1857 | 0.4723 | |
| SRP007169 | PIGS | 94005 | RNAseq | 1.7929 | 0.0046 | |
| SRP008496 | PIGS | 94005 | RNAseq | 1.2614 | 0.0021 | |
| SRP064894 | PIGS | 94005 | RNAseq | 0.1128 | 0.4114 | |
| SRP133303 | PIGS | 94005 | RNAseq | 0.1408 | 0.2496 | |
| SRP159526 | PIGS | 94005 | RNAseq | 0.0751 | 0.7365 | |
| SRP193095 | PIGS | 94005 | RNAseq | -0.0882 | 0.5326 | |
| SRP219564 | PIGS | 94005 | RNAseq | -0.1663 | 0.7321 | |
| TCGA | PIGS | 94005 | RNAseq | 0.0149 | 0.7562 |
Upregulated datasets: 2; Downregulated datasets: 0.
Survival by PIGS expression:
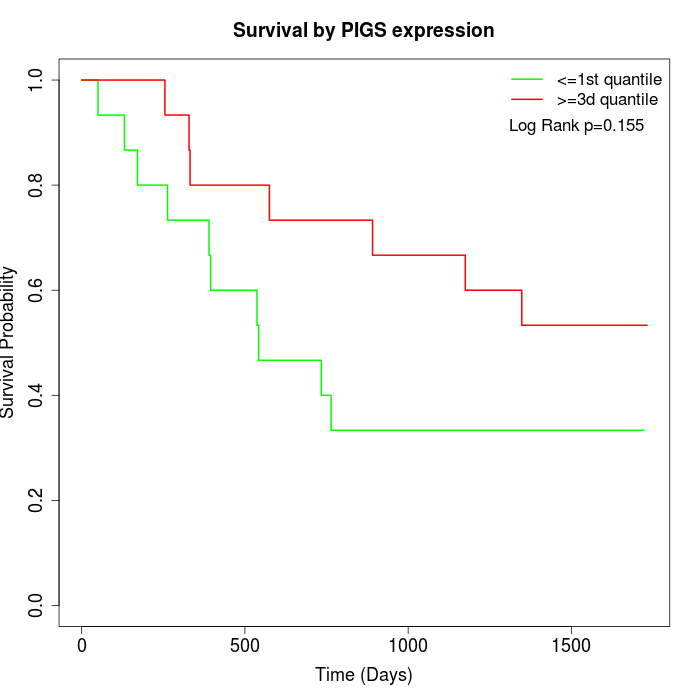 | 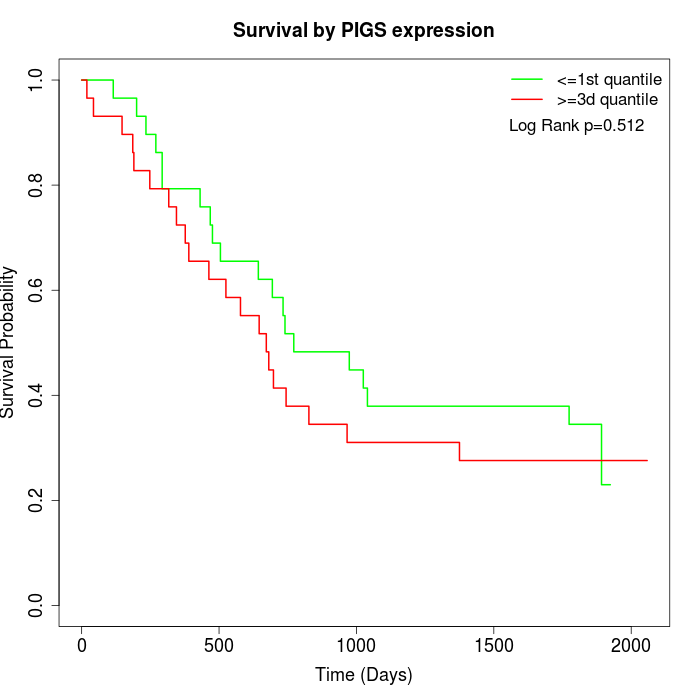 | 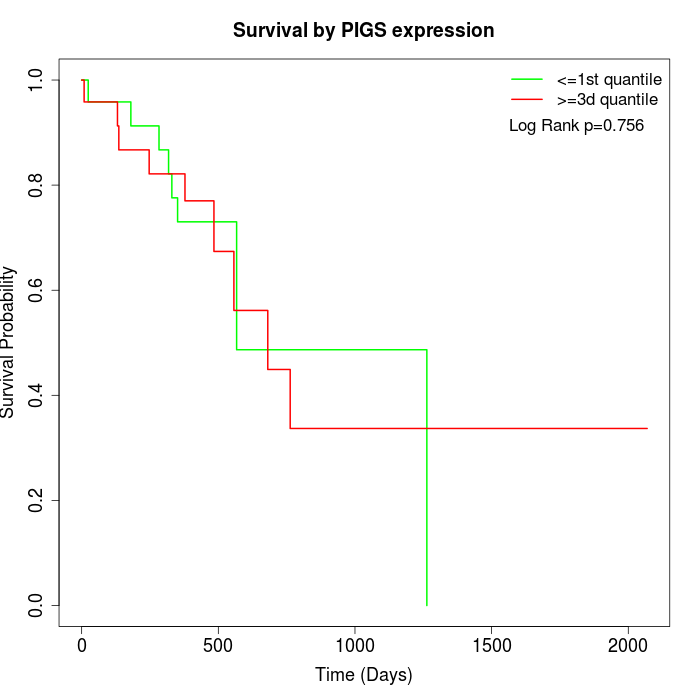 |
| GSE53622 | GSE53624 | TCGA |
Note: Click image to view full size file.
Copy number change of PIGS:
| Dataset | Gene | EntrezID | Gain | Loss | Normal | Detail |
|---|---|---|---|---|---|---|
| GSE15526 | PIGS | 94005 | 9 | 1 | 20 | |
| GSE20123 | PIGS | 94005 | 9 | 1 | 20 | |
| GSE43470 | PIGS | 94005 | 0 | 1 | 42 | |
| GSE46452 | PIGS | 94005 | 33 | 1 | 25 | |
| GSE47630 | PIGS | 94005 | 7 | 1 | 32 | |
| GSE54993 | PIGS | 94005 | 2 | 3 | 65 | |
| GSE54994 | PIGS | 94005 | 7 | 6 | 40 | |
| GSE60625 | PIGS | 94005 | 4 | 0 | 7 | |
| GSE74703 | PIGS | 94005 | 0 | 1 | 35 | |
| GSE74704 | PIGS | 94005 | 7 | 1 | 12 | |
| TCGA | PIGS | 94005 | 21 | 10 | 65 |
Total number of gains: 99; Total number of losses: 26; Total Number of normals: 363.
Somatic mutations of PIGS:
Generating mutation plots.
Highly correlated genes for PIGS:
Showing top 20/275 corelated genes with mean PCC>0.5.
| Gene1 | Gene2 | Mean PCC | Num. Datasets | Num. PCC<0 | Num. PCC>0.5 |
|---|---|---|---|---|---|
| PIGS | CD93 | 0.845275 | 3 | 0 | 3 |
| PIGS | PSMC5 | 0.789032 | 3 | 0 | 3 |
| PIGS | NDUFA9 | 0.783936 | 4 | 0 | 4 |
| PIGS | NUP50 | 0.780368 | 3 | 0 | 3 |
| PIGS | TLK2 | 0.777097 | 4 | 0 | 4 |
| PIGS | USP3 | 0.763297 | 3 | 0 | 3 |
| PIGS | DHX33 | 0.759158 | 3 | 0 | 3 |
| PIGS | GOSR2 | 0.750516 | 3 | 0 | 3 |
| PIGS | TLR1 | 0.749599 | 3 | 0 | 3 |
| PIGS | RCN2 | 0.748417 | 3 | 0 | 3 |
| PIGS | RILPL2 | 0.745512 | 3 | 0 | 3 |
| PIGS | MED27 | 0.745313 | 3 | 0 | 3 |
| PIGS | CCL18 | 0.745188 | 3 | 0 | 3 |
| PIGS | TMEM185A | 0.743852 | 3 | 0 | 3 |
| PIGS | PDE4B | 0.742858 | 3 | 0 | 3 |
| PIGS | RHOH | 0.740288 | 3 | 0 | 3 |
| PIGS | WDR81 | 0.736556 | 3 | 0 | 3 |
| PIGS | RAD23A | 0.734878 | 3 | 0 | 3 |
| PIGS | SLC25A24 | 0.732639 | 3 | 0 | 3 |
| PIGS | PHLPP1 | 0.730514 | 3 | 0 | 3 |
For details and further investigation, click here