| Full name: toll like receptor 1 | Alias Symbol: rsc786|KIAA0012|CD281 | ||
| Type: protein-coding gene | Cytoband: 4p14 | ||
| Entrez ID: 7096 | HGNC ID: HGNC:11847 | Ensembl Gene: ENSG00000174125 | OMIM ID: 601194 |
TLR1 involved pathways:
| KEGG pathway | Description | View |
|---|---|---|
| hsa04620 | Toll-like receptor signaling pathway | |
| hsa05152 | Tuberculosis |
Expression of TLR1:
| Dataset | Gene | EntrezID | Probe | Log2FC | Adj.pValue | Expression |
|---|---|---|---|---|---|---|
| GSE17351 | TLR1 | 7096 | 210176_at | 0.0854 | 0.9534 | |
| GSE20347 | TLR1 | 7096 | 210176_at | 0.3368 | 0.0117 | |
| GSE23400 | TLR1 | 7096 | 210176_at | 0.1366 | 0.0083 | |
| GSE26886 | TLR1 | 7096 | 210176_at | 0.1116 | 0.8304 | |
| GSE29001 | TLR1 | 7096 | 210176_at | 0.6284 | 0.0235 | |
| GSE38129 | TLR1 | 7096 | 210176_at | 0.5784 | 0.0001 | |
| GSE45670 | TLR1 | 7096 | 210176_at | -0.2560 | 0.4412 | |
| GSE53622 | TLR1 | 7096 | 75882 | 0.5957 | 0.0001 | |
| GSE53624 | TLR1 | 7096 | 75882 | 0.5142 | 0.0023 | |
| GSE63941 | TLR1 | 7096 | 210176_at | 0.5555 | 0.6753 | |
| GSE77861 | TLR1 | 7096 | 210176_at | 0.1383 | 0.4400 | |
| GSE97050 | TLR1 | 7096 | A_23_P10873 | 0.5564 | 0.1670 | |
| SRP007169 | TLR1 | 7096 | RNAseq | 1.3808 | 0.0098 | |
| SRP008496 | TLR1 | 7096 | RNAseq | 1.2519 | 0.0010 | |
| SRP064894 | TLR1 | 7096 | RNAseq | 0.6037 | 0.0288 | |
| SRP133303 | TLR1 | 7096 | RNAseq | 0.5004 | 0.0402 | |
| SRP159526 | TLR1 | 7096 | RNAseq | 0.5427 | 0.4746 | |
| SRP193095 | TLR1 | 7096 | RNAseq | 0.8014 | 0.0006 | |
| SRP219564 | TLR1 | 7096 | RNAseq | 0.4190 | 0.4252 | |
| TCGA | TLR1 | 7096 | RNAseq | 0.3359 | 0.0146 |
Upregulated datasets: 2; Downregulated datasets: 0.
Survival by TLR1 expression:
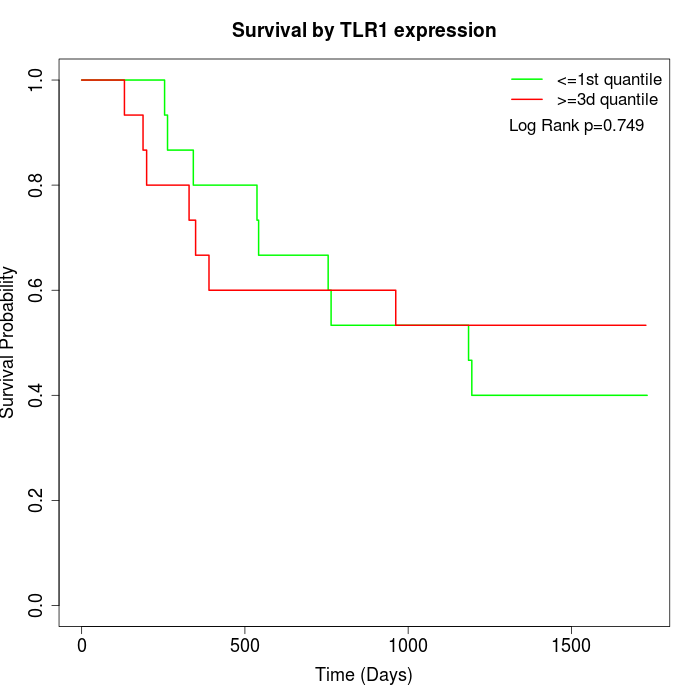 | 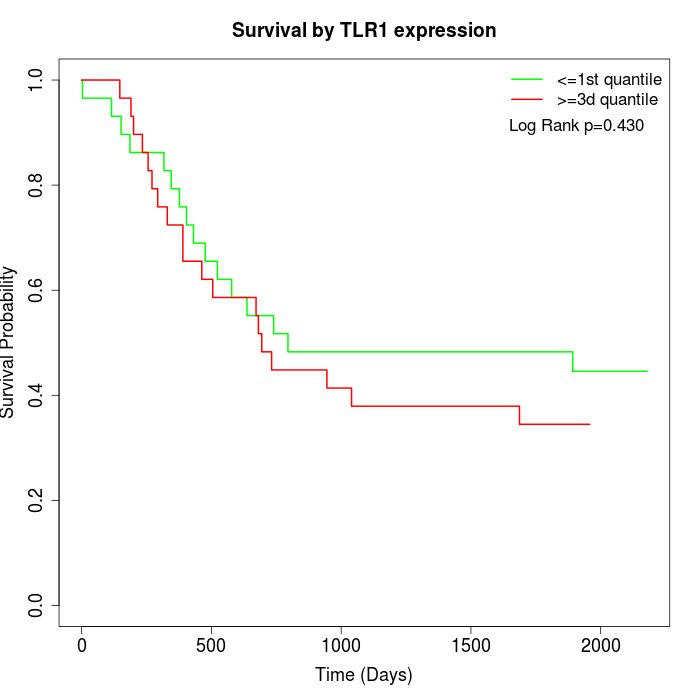 | 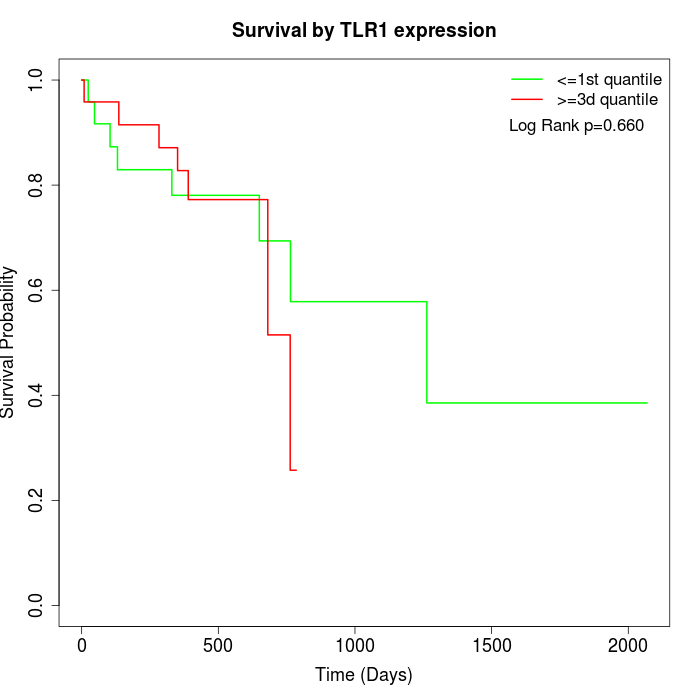 |
| GSE53622 | GSE53624 | TCGA |
Note: Click image to view full size file.
Copy number change of TLR1:
| Dataset | Gene | EntrezID | Gain | Loss | Normal | Detail |
|---|---|---|---|---|---|---|
| GSE15526 | TLR1 | 7096 | 0 | 16 | 14 | |
| GSE20123 | TLR1 | 7096 | 0 | 16 | 14 | |
| GSE43470 | TLR1 | 7096 | 0 | 15 | 28 | |
| GSE46452 | TLR1 | 7096 | 1 | 36 | 22 | |
| GSE47630 | TLR1 | 7096 | 1 | 19 | 20 | |
| GSE54993 | TLR1 | 7096 | 8 | 0 | 62 | |
| GSE54994 | TLR1 | 7096 | 4 | 10 | 39 | |
| GSE60625 | TLR1 | 7096 | 0 | 0 | 11 | |
| GSE74703 | TLR1 | 7096 | 0 | 12 | 24 | |
| GSE74704 | TLR1 | 7096 | 0 | 9 | 11 | |
| TCGA | TLR1 | 7096 | 11 | 45 | 40 |
Total number of gains: 25; Total number of losses: 178; Total Number of normals: 285.
Somatic mutations of TLR1:
Generating mutation plots.
Highly correlated genes for TLR1:
Showing top 20/712 corelated genes with mean PCC>0.5.
| Gene1 | Gene2 | Mean PCC | Num. Datasets | Num. PCC<0 | Num. PCC>0.5 |
|---|---|---|---|---|---|
| TLR1 | FCGR3A | 0.795317 | 3 | 0 | 3 |
| TLR1 | ZNF18 | 0.779972 | 3 | 0 | 3 |
| TLR1 | GPR141 | 0.761438 | 3 | 0 | 3 |
| TLR1 | IL2RA | 0.756897 | 4 | 0 | 4 |
| TLR1 | PIGS | 0.749599 | 3 | 0 | 3 |
| TLR1 | C19orf38 | 0.740325 | 3 | 0 | 3 |
| TLR1 | CD226 | 0.737736 | 3 | 0 | 3 |
| TLR1 | SLC25A5 | 0.729964 | 3 | 0 | 3 |
| TLR1 | CERKL | 0.729715 | 3 | 0 | 3 |
| TLR1 | TCN2 | 0.723188 | 4 | 0 | 4 |
| TLR1 | SPPL2A | 0.719594 | 3 | 0 | 3 |
| TLR1 | ASCC1 | 0.717186 | 3 | 0 | 3 |
| TLR1 | SAMM50 | 0.716398 | 3 | 0 | 3 |
| TLR1 | ITGAM | 0.709497 | 9 | 0 | 8 |
| TLR1 | FNTA | 0.706578 | 3 | 0 | 3 |
| TLR1 | GUCY1A2 | 0.705306 | 3 | 0 | 3 |
| TLR1 | ANPEP | 0.702729 | 4 | 0 | 3 |
| TLR1 | PPP1R16B | 0.698731 | 4 | 0 | 4 |
| TLR1 | SLFN11 | 0.697525 | 6 | 0 | 6 |
| TLR1 | DRG1 | 0.697284 | 4 | 0 | 3 |
For details and further investigation, click here