| Full name: phospholipase D family member 4 | Alias Symbol: | ||
| Type: protein-coding gene | Cytoband: 14q32.33 | ||
| Entrez ID: 122618 | HGNC ID: HGNC:23792 | Ensembl Gene: ENSG00000166428 | OMIM ID: |
Expression of PLD4:
| Dataset | Gene | EntrezID | Probe | Log2FC | Adj.pValue | Expression |
|---|---|---|---|---|---|---|
| GSE17351 | PLD4 | 122618 | 1566433_at | -0.1584 | 0.5018 | |
| GSE26886 | PLD4 | 122618 | 235802_at | 0.2157 | 0.0527 | |
| GSE45670 | PLD4 | 122618 | 1566433_at | 0.1305 | 0.1258 | |
| GSE53622 | PLD4 | 122618 | 12434 | -0.3384 | 0.0165 | |
| GSE53624 | PLD4 | 122618 | 12434 | -0.5013 | 0.0002 | |
| GSE63941 | PLD4 | 122618 | 235802_at | 0.0073 | 0.9585 | |
| GSE77861 | PLD4 | 122618 | 235802_at | -0.1028 | 0.5525 | |
| GSE97050 | PLD4 | 122618 | A_23_P88222 | 0.5125 | 0.2038 | |
| SRP064894 | PLD4 | 122618 | RNAseq | 1.6383 | 0.0237 | |
| SRP133303 | PLD4 | 122618 | RNAseq | -0.6528 | 0.0212 | |
| SRP159526 | PLD4 | 122618 | RNAseq | -0.8908 | 0.2661 | |
| SRP193095 | PLD4 | 122618 | RNAseq | -0.3838 | 0.0307 | |
| SRP219564 | PLD4 | 122618 | RNAseq | 0.7569 | 0.2822 | |
| TCGA | PLD4 | 122618 | RNAseq | 0.3379 | 0.3705 |
Upregulated datasets: 1; Downregulated datasets: 0.
Survival by PLD4 expression:
 | 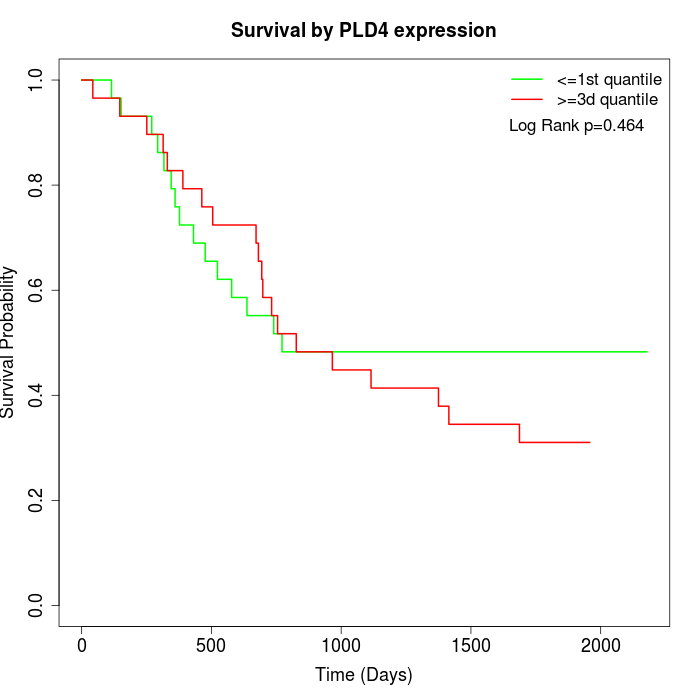 | 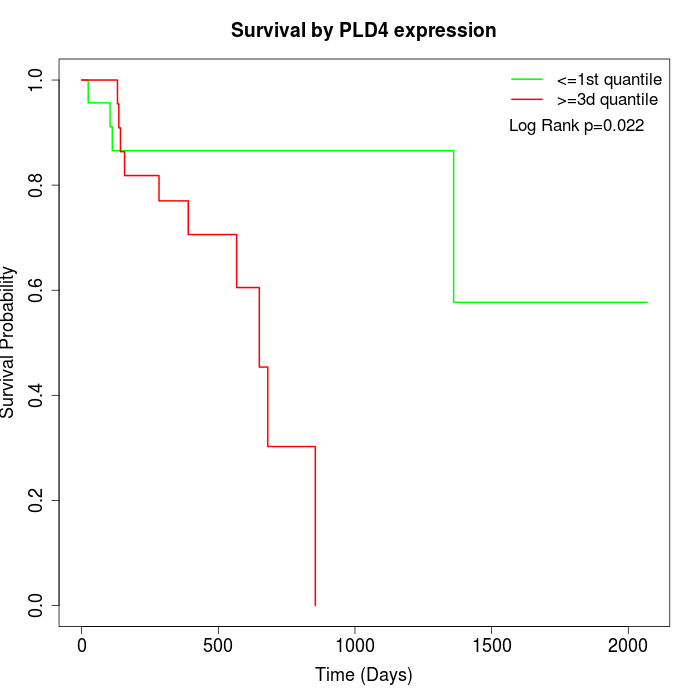 |
| GSE53622 | GSE53624 | TCGA |
Note: Click image to view full size file.
Copy number change of PLD4:
| Dataset | Gene | EntrezID | Gain | Loss | Normal | Detail |
|---|---|---|---|---|---|---|
| GSE15526 | PLD4 | 122618 | 11 | 3 | 16 | |
| GSE20123 | PLD4 | 122618 | 10 | 2 | 18 | |
| GSE43470 | PLD4 | 122618 | 6 | 4 | 33 | |
| GSE46452 | PLD4 | 122618 | 18 | 4 | 37 | |
| GSE47630 | PLD4 | 122618 | 10 | 8 | 22 | |
| GSE54993 | PLD4 | 122618 | 4 | 10 | 56 | |
| GSE54994 | PLD4 | 122618 | 21 | 4 | 28 | |
| GSE60625 | PLD4 | 122618 | 0 | 2 | 9 | |
| GSE74703 | PLD4 | 122618 | 5 | 3 | 28 | |
| GSE74704 | PLD4 | 122618 | 5 | 2 | 13 | |
| TCGA | PLD4 | 122618 | 32 | 18 | 46 |
Total number of gains: 122; Total number of losses: 60; Total Number of normals: 306.
Somatic mutations of PLD4:
Generating mutation plots.
Highly correlated genes for PLD4:
Showing top 20/135 corelated genes with mean PCC>0.5.
| Gene1 | Gene2 | Mean PCC | Num. Datasets | Num. PCC<0 | Num. PCC>0.5 |
|---|---|---|---|---|---|
| PLD4 | TMEM184A | 0.778658 | 3 | 0 | 3 |
| PLD4 | ARHGAP30 | 0.760455 | 4 | 0 | 4 |
| PLD4 | ATAD3C | 0.739794 | 3 | 0 | 3 |
| PLD4 | TBC1D10C | 0.739594 | 3 | 0 | 3 |
| PLD4 | LILRA3 | 0.73704 | 3 | 0 | 3 |
| PLD4 | C19orf81 | 0.724503 | 4 | 0 | 4 |
| PLD4 | FUT7 | 0.724313 | 4 | 0 | 4 |
| PLD4 | REG3A | 0.71488 | 3 | 0 | 3 |
| PLD4 | STK32C | 0.714438 | 4 | 0 | 4 |
| PLD4 | CBS | 0.714214 | 3 | 0 | 3 |
| PLD4 | CD40LG | 0.701961 | 3 | 0 | 3 |
| PLD4 | PTGER1 | 0.701418 | 3 | 0 | 3 |
| PLD4 | CARD9 | 0.701227 | 3 | 0 | 3 |
| PLD4 | HOXB9 | 0.697752 | 3 | 0 | 3 |
| PLD4 | RCOR2 | 0.694996 | 3 | 0 | 3 |
| PLD4 | SLC13A3 | 0.691317 | 3 | 0 | 3 |
| PLD4 | ODF3B | 0.682526 | 4 | 0 | 3 |
| PLD4 | CNGB1 | 0.681836 | 4 | 0 | 3 |
| PLD4 | SSTR2 | 0.679536 | 3 | 0 | 3 |
| PLD4 | KLHDC7B | 0.67476 | 3 | 0 | 3 |
For details and further investigation, click here