| Full name: phosphomannomutase 2 | Alias Symbol: CDGS|CDG1a|PMI|PMI1 | ||
| Type: protein-coding gene | Cytoband: 16p13.2 | ||
| Entrez ID: 5373 | HGNC ID: HGNC:9115 | Ensembl Gene: ENSG00000140650 | OMIM ID: 601785 |
Screen Evidence:
| |||
Expression of PMM2:
| Dataset | Gene | EntrezID | Probe | Log2FC | Adj.pValue | Expression |
|---|---|---|---|---|---|---|
| GSE17351 | PMM2 | 5373 | 203201_at | 0.3784 | 0.5181 | |
| GSE20347 | PMM2 | 5373 | 203201_at | 0.0683 | 0.6710 | |
| GSE23400 | PMM2 | 5373 | 203201_at | 0.3303 | 0.0000 | |
| GSE26886 | PMM2 | 5373 | 203201_at | 0.1582 | 0.4332 | |
| GSE29001 | PMM2 | 5373 | 203201_at | 0.2602 | 0.3248 | |
| GSE38129 | PMM2 | 5373 | 203201_at | 0.2777 | 0.0511 | |
| GSE45670 | PMM2 | 5373 | 203201_at | 0.3470 | 0.0249 | |
| GSE63941 | PMM2 | 5373 | 203201_at | -0.2453 | 0.5576 | |
| GSE77861 | PMM2 | 5373 | 203201_at | 0.0713 | 0.8031 | |
| GSE97050 | PMM2 | 5373 | A_23_P432360 | 1.2713 | 0.1133 | |
| SRP007169 | PMM2 | 5373 | RNAseq | -0.1032 | 0.7421 | |
| SRP008496 | PMM2 | 5373 | RNAseq | -0.0585 | 0.7891 | |
| SRP064894 | PMM2 | 5373 | RNAseq | 0.1531 | 0.2711 | |
| SRP133303 | PMM2 | 5373 | RNAseq | 0.6038 | 0.0007 | |
| SRP159526 | PMM2 | 5373 | RNAseq | -0.2338 | 0.4277 | |
| SRP193095 | PMM2 | 5373 | RNAseq | 0.0673 | 0.4994 | |
| SRP219564 | PMM2 | 5373 | RNAseq | 0.7329 | 0.0663 | |
| TCGA | PMM2 | 5373 | RNAseq | 0.0538 | 0.3299 |
Upregulated datasets: 0; Downregulated datasets: 0.
Survival by PMM2 expression:
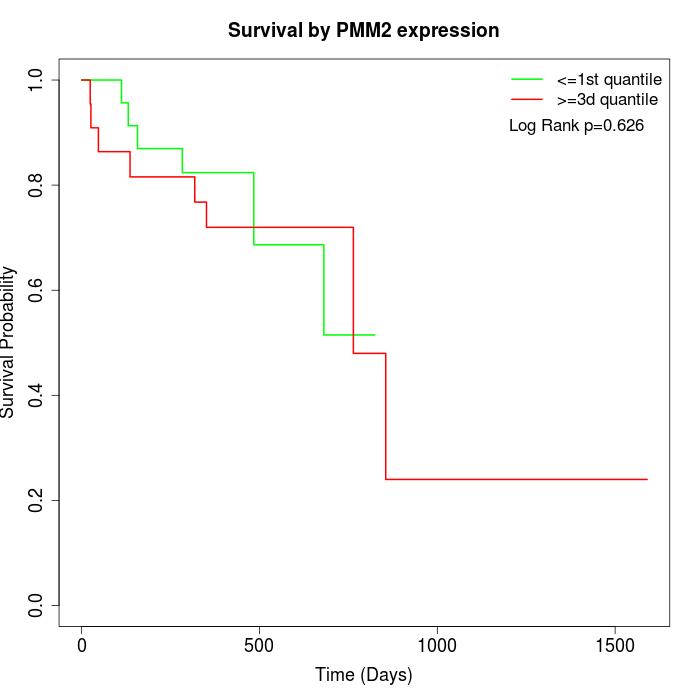 |
| TCGA |
Note: Click image to view full size file.
Copy number change of PMM2:
| Dataset | Gene | EntrezID | Gain | Loss | Normal | Detail |
|---|---|---|---|---|---|---|
| GSE15526 | PMM2 | 5373 | 4 | 4 | 22 | |
| GSE20123 | PMM2 | 5373 | 4 | 3 | 23 | |
| GSE43470 | PMM2 | 5373 | 3 | 2 | 38 | |
| GSE46452 | PMM2 | 5373 | 38 | 1 | 20 | |
| GSE47630 | PMM2 | 5373 | 13 | 6 | 21 | |
| GSE54993 | PMM2 | 5373 | 3 | 5 | 62 | |
| GSE54994 | PMM2 | 5373 | 5 | 9 | 39 | |
| GSE60625 | PMM2 | 5373 | 4 | 0 | 7 | |
| GSE74703 | PMM2 | 5373 | 3 | 2 | 31 | |
| GSE74704 | PMM2 | 5373 | 2 | 1 | 17 | |
| TCGA | PMM2 | 5373 | 21 | 12 | 63 |
Total number of gains: 100; Total number of losses: 45; Total Number of normals: 343.
Somatic mutations of PMM2:
Generating mutation plots.
Highly correlated genes for PMM2:
Showing top 20/456 corelated genes with mean PCC>0.5.
| Gene1 | Gene2 | Mean PCC | Num. Datasets | Num. PCC<0 | Num. PCC>0.5 |
|---|---|---|---|---|---|
| PMM2 | CARD11 | 0.785166 | 3 | 0 | 3 |
| PMM2 | DTD1 | 0.759666 | 3 | 0 | 3 |
| PMM2 | ACER3 | 0.752267 | 3 | 0 | 3 |
| PMM2 | FAM111B | 0.742303 | 3 | 0 | 3 |
| PMM2 | FBXL19 | 0.728235 | 5 | 0 | 5 |
| PMM2 | RHOG | 0.726606 | 3 | 0 | 3 |
| PMM2 | ANLN | 0.71449 | 3 | 0 | 3 |
| PMM2 | PRC1 | 0.713721 | 4 | 0 | 4 |
| PMM2 | FOPNL | 0.711154 | 3 | 0 | 3 |
| PMM2 | DUSP18 | 0.709439 | 3 | 0 | 3 |
| PMM2 | TRAF7 | 0.702559 | 5 | 0 | 5 |
| PMM2 | FIBP | 0.700015 | 4 | 0 | 4 |
| PMM2 | UCHL5 | 0.698569 | 3 | 0 | 3 |
| PMM2 | RAN | 0.695385 | 4 | 0 | 4 |
| PMM2 | UQCR10 | 0.695008 | 3 | 0 | 3 |
| PMM2 | SLC30A7 | 0.693981 | 3 | 0 | 3 |
| PMM2 | PSMG3 | 0.693506 | 4 | 0 | 3 |
| PMM2 | CNOT7 | 0.692187 | 3 | 0 | 3 |
| PMM2 | SLC39A9 | 0.688876 | 3 | 0 | 3 |
| PMM2 | AQR | 0.688301 | 4 | 0 | 3 |
For details and further investigation, click here