| Full name: prostaglandin I2 synthase | Alias Symbol: PGIS|CYP8A1 | ||
| Type: protein-coding gene | Cytoband: 20q13.13 | ||
| Entrez ID: 5740 | HGNC ID: HGNC:9603 | Ensembl Gene: ENSG00000124212 | OMIM ID: 601699 |
| Related drugs: PHENYLBUTAZONE... [more] | |||
Expression of PTGIS:
| Dataset | Gene | EntrezID | Probe | Log2FC | Adj.pValue | Expression |
|---|---|---|---|---|---|---|
| GSE17351 | PTGIS | 5740 | 208131_s_at | -2.3554 | 0.1377 | |
| GSE20347 | PTGIS | 5740 | 208131_s_at | -0.1408 | 0.7036 | |
| GSE23400 | PTGIS | 5740 | 208131_s_at | -0.6148 | 0.0010 | |
| GSE26886 | PTGIS | 5740 | 208131_s_at | 0.7705 | 0.0984 | |
| GSE29001 | PTGIS | 5740 | 208131_s_at | -0.0529 | 0.9237 | |
| GSE38129 | PTGIS | 5740 | 208131_s_at | -0.9103 | 0.1054 | |
| GSE45670 | PTGIS | 5740 | 208131_s_at | -4.1309 | 0.0000 | |
| GSE53622 | PTGIS | 5740 | 6386 | -2.6578 | 0.0000 | |
| GSE53624 | PTGIS | 5740 | 6386 | -2.6858 | 0.0000 | |
| GSE63941 | PTGIS | 5740 | 208131_s_at | -5.0169 | 0.0000 | |
| GSE77861 | PTGIS | 5740 | 211892_s_at | -0.0789 | 0.3480 | |
| GSE97050 | PTGIS | 5740 | A_24_P48723 | -1.2922 | 0.1616 | |
| SRP007169 | PTGIS | 5740 | RNAseq | 2.2444 | 0.0002 | |
| SRP008496 | PTGIS | 5740 | RNAseq | 3.0039 | 0.0000 | |
| SRP064894 | PTGIS | 5740 | RNAseq | 0.4272 | 0.4344 | |
| SRP133303 | PTGIS | 5740 | RNAseq | -1.2946 | 0.0062 | |
| SRP159526 | PTGIS | 5740 | RNAseq | 0.7288 | 0.3702 | |
| SRP193095 | PTGIS | 5740 | RNAseq | -0.4422 | 0.0840 | |
| SRP219564 | PTGIS | 5740 | RNAseq | 0.0036 | 0.9978 | |
| TCGA | PTGIS | 5740 | RNAseq | -1.1997 | 0.0006 |
Upregulated datasets: 2; Downregulated datasets: 6.
Survival by PTGIS expression:
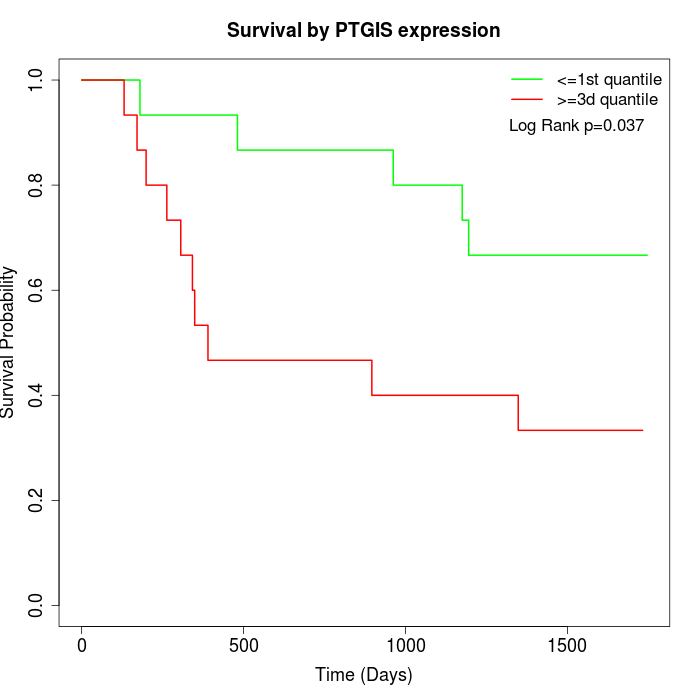 | 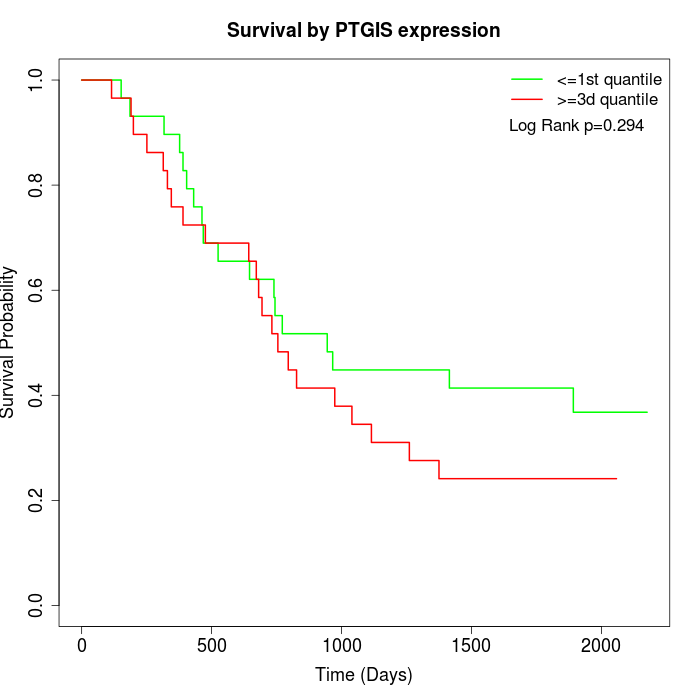 | 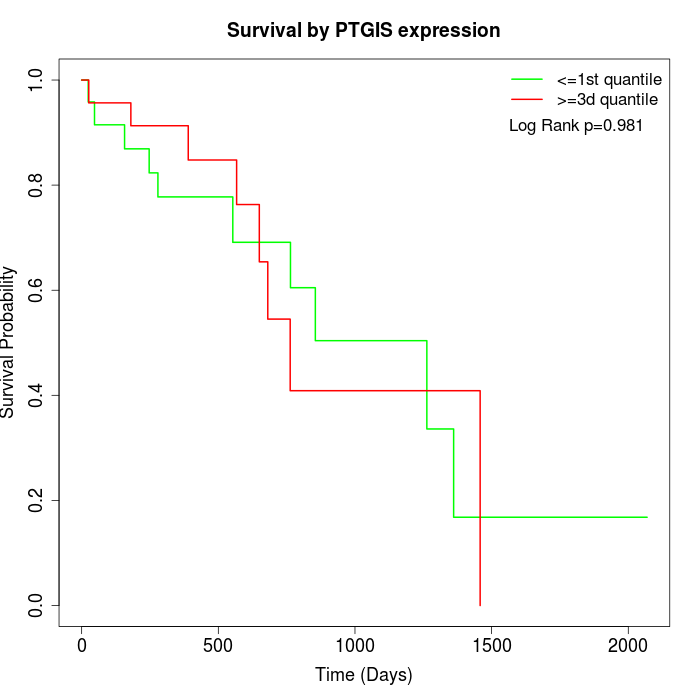 |
| GSE53622 | GSE53624 | TCGA |
Note: Click image to view full size file.
Copy number change of PTGIS:
| Dataset | Gene | EntrezID | Gain | Loss | Normal | Detail |
|---|---|---|---|---|---|---|
| GSE15526 | PTGIS | 5740 | 16 | 2 | 12 | |
| GSE20123 | PTGIS | 5740 | 16 | 2 | 12 | |
| GSE43470 | PTGIS | 5740 | 13 | 0 | 30 | |
| GSE46452 | PTGIS | 5740 | 29 | 0 | 30 | |
| GSE47630 | PTGIS | 5740 | 24 | 1 | 15 | |
| GSE54993 | PTGIS | 5740 | 0 | 17 | 53 | |
| GSE54994 | PTGIS | 5740 | 27 | 0 | 26 | |
| GSE60625 | PTGIS | 5740 | 0 | 0 | 11 | |
| GSE74703 | PTGIS | 5740 | 11 | 0 | 25 | |
| GSE74704 | PTGIS | 5740 | 12 | 0 | 8 | |
| TCGA | PTGIS | 5740 | 46 | 3 | 47 |
Total number of gains: 194; Total number of losses: 25; Total Number of normals: 269.
Somatic mutations of PTGIS:
Generating mutation plots.
Highly correlated genes for PTGIS:
Showing top 20/1120 corelated genes with mean PCC>0.5.
| Gene1 | Gene2 | Mean PCC | Num. Datasets | Num. PCC<0 | Num. PCC>0.5 |
|---|---|---|---|---|---|
| PTGIS | LINC01279 | 0.888183 | 4 | 0 | 4 |
| PTGIS | ABCA9 | 0.812059 | 3 | 0 | 3 |
| PTGIS | MAMDC2 | 0.802281 | 6 | 0 | 6 |
| PTGIS | PDE1A | 0.797537 | 9 | 0 | 9 |
| PTGIS | MYOCD | 0.794008 | 7 | 0 | 7 |
| PTGIS | CYP4V2 | 0.787206 | 4 | 0 | 4 |
| PTGIS | ID4 | 0.786983 | 4 | 0 | 4 |
| PTGIS | RNF150 | 0.77974 | 7 | 0 | 7 |
| PTGIS | AOC3 | 0.775638 | 12 | 0 | 12 |
| PTGIS | SPARCL1 | 0.774854 | 10 | 0 | 10 |
| PTGIS | ZMAT1 | 0.771716 | 5 | 0 | 5 |
| PTGIS | LRRK2 | 0.771206 | 6 | 0 | 6 |
| PTGIS | CLEC3B | 0.771119 | 3 | 0 | 3 |
| PTGIS | RIC3 | 0.76322 | 4 | 0 | 4 |
| PTGIS | FBXL3 | 0.761264 | 4 | 0 | 4 |
| PTGIS | CHRDL1 | 0.760297 | 10 | 0 | 9 |
| PTGIS | EMCN | 0.760037 | 5 | 0 | 5 |
| PTGIS | ADAMTS9-AS2 | 0.75957 | 5 | 0 | 5 |
| PTGIS | ABCA8 | 0.759228 | 10 | 0 | 8 |
| PTGIS | LONRF2 | 0.758794 | 5 | 0 | 5 |
For details and further investigation, click here