| Full name: phosphodiesterase 1A | Alias Symbol: | ||
| Type: protein-coding gene | Cytoband: 2q32.1 | ||
| Entrez ID: 5136 | HGNC ID: HGNC:8774 | Ensembl Gene: ENSG00000115252 | OMIM ID: 171890 |
| Related drugs: BEPRIDIL, CRISABOROLE, DIPYRIDAMOLE, PENTOXIFYLLINE, VINPOCETINE... [more] | |||
PDE1A involved pathways:
| KEGG pathway | Description | View |
|---|---|---|
| hsa04020 | Calcium signaling pathway | |
| hsa04740 | Olfactory transduction | |
| hsa04742 | Taste transduction | |
| hsa04924 | Renin secretion |
Expression of PDE1A:
| Dataset | Gene | EntrezID | Probe | Log2FC | Adj.pValue | Expression |
|---|---|---|---|---|---|---|
| GSE17351 | PDE1A | 5136 | 208396_s_at | -1.0744 | 0.1662 | |
| GSE20347 | PDE1A | 5136 | 208396_s_at | -0.3128 | 0.0102 | |
| GSE23400 | PDE1A | 5136 | 208396_s_at | -0.1342 | 0.0358 | |
| GSE26886 | PDE1A | 5136 | 208396_s_at | 0.5225 | 0.0730 | |
| GSE29001 | PDE1A | 5136 | 208396_s_at | -0.7112 | 0.0363 | |
| GSE38129 | PDE1A | 5136 | 208396_s_at | -0.9467 | 0.0041 | |
| GSE45670 | PDE1A | 5136 | 208396_s_at | -2.2798 | 0.0000 | |
| GSE53622 | PDE1A | 5136 | 9986 | -1.1790 | 0.0000 | |
| GSE53624 | PDE1A | 5136 | 9986 | -1.0381 | 0.0000 | |
| GSE63941 | PDE1A | 5136 | 208396_s_at | -1.9159 | 0.0012 | |
| GSE77861 | PDE1A | 5136 | 208396_s_at | 0.0022 | 0.9882 | |
| GSE97050 | PDE1A | 5136 | A_24_P208436 | -0.5088 | 0.1246 | |
| SRP007169 | PDE1A | 5136 | RNAseq | 0.3709 | 0.6053 | |
| SRP064894 | PDE1A | 5136 | RNAseq | 0.0202 | 0.9627 | |
| SRP133303 | PDE1A | 5136 | RNAseq | -1.3742 | 0.0001 | |
| SRP159526 | PDE1A | 5136 | RNAseq | -0.8188 | 0.0833 | |
| SRP193095 | PDE1A | 5136 | RNAseq | -0.6887 | 0.0772 | |
| SRP219564 | PDE1A | 5136 | RNAseq | 0.3046 | 0.7442 | |
| TCGA | PDE1A | 5136 | RNAseq | -1.1937 | 0.0000 |
Upregulated datasets: 0; Downregulated datasets: 6.
Survival by PDE1A expression:
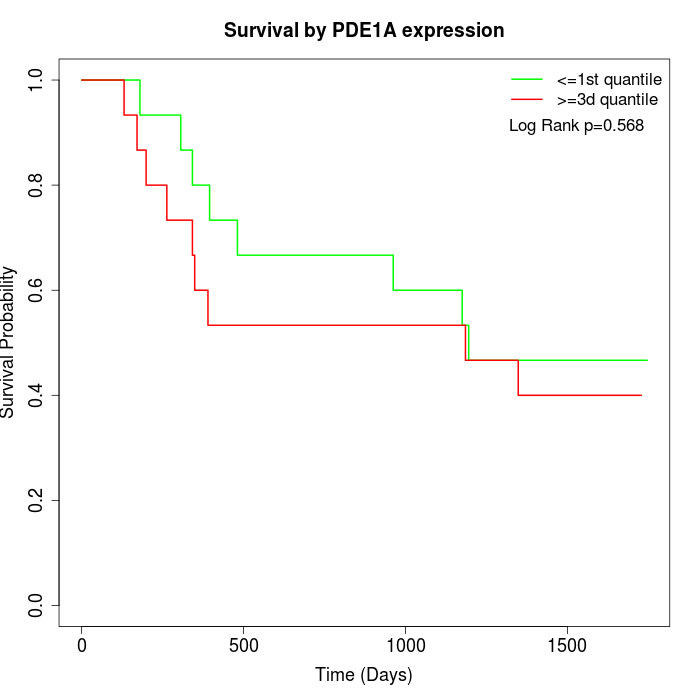 | 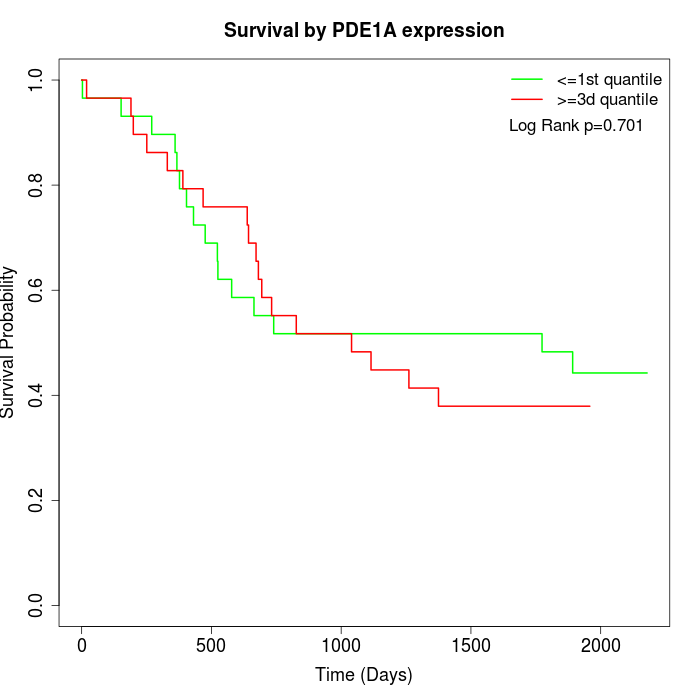 | 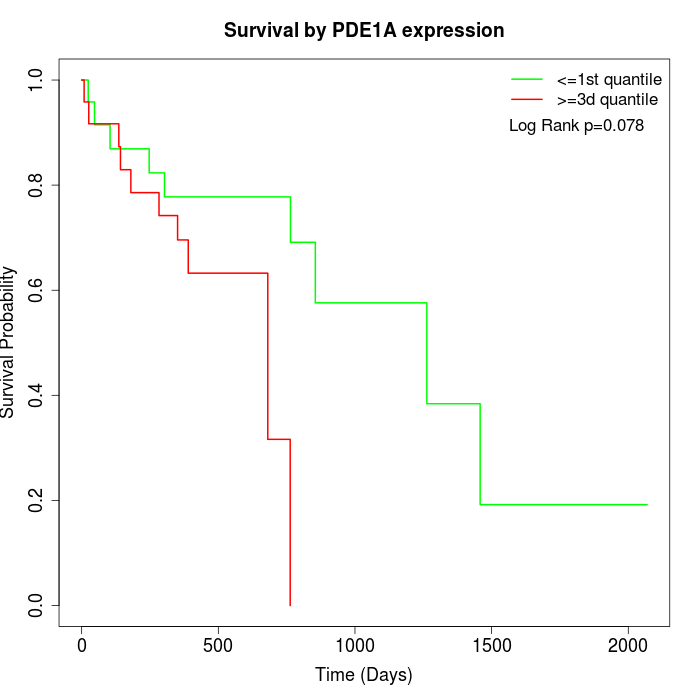 |
| GSE53622 | GSE53624 | TCGA |
Note: Click image to view full size file.
Copy number change of PDE1A:
| Dataset | Gene | EntrezID | Gain | Loss | Normal | Detail |
|---|---|---|---|---|---|---|
| GSE15526 | PDE1A | 5136 | 5 | 1 | 24 | |
| GSE20123 | PDE1A | 5136 | 5 | 1 | 24 | |
| GSE43470 | PDE1A | 5136 | 5 | 1 | 37 | |
| GSE46452 | PDE1A | 5136 | 1 | 4 | 54 | |
| GSE47630 | PDE1A | 5136 | 4 | 4 | 32 | |
| GSE54993 | PDE1A | 5136 | 0 | 5 | 65 | |
| GSE54994 | PDE1A | 5136 | 12 | 5 | 36 | |
| GSE60625 | PDE1A | 5136 | 0 | 3 | 8 | |
| GSE74703 | PDE1A | 5136 | 4 | 1 | 31 | |
| GSE74704 | PDE1A | 5136 | 2 | 1 | 17 | |
| TCGA | PDE1A | 5136 | 25 | 9 | 62 |
Total number of gains: 63; Total number of losses: 35; Total Number of normals: 390.
Somatic mutations of PDE1A:
Generating mutation plots.
Highly correlated genes for PDE1A:
Showing top 20/1407 corelated genes with mean PCC>0.5.
| Gene1 | Gene2 | Mean PCC | Num. Datasets | Num. PCC<0 | Num. PCC>0.5 |
|---|---|---|---|---|---|
| PDE1A | FAM13C | 0.863845 | 4 | 0 | 4 |
| PDE1A | AFF3 | 0.835814 | 3 | 0 | 3 |
| PDE1A | LRRN4CL | 0.826606 | 7 | 0 | 7 |
| PDE1A | LRFN5 | 0.825343 | 5 | 0 | 5 |
| PDE1A | SORCS1 | 0.825119 | 5 | 0 | 5 |
| PDE1A | MEOX2 | 0.82464 | 8 | 0 | 7 |
| PDE1A | RASSF3 | 0.809371 | 4 | 0 | 4 |
| PDE1A | PTGIS | 0.797537 | 9 | 0 | 9 |
| PDE1A | FGF7 | 0.797304 | 8 | 0 | 8 |
| PDE1A | ANO5 | 0.796836 | 6 | 0 | 6 |
| PDE1A | C1QTNF7 | 0.792662 | 6 | 0 | 5 |
| PDE1A | CLEC3B | 0.790728 | 3 | 0 | 3 |
| PDE1A | MFAP4 | 0.790468 | 10 | 0 | 10 |
| PDE1A | OGN | 0.788509 | 10 | 0 | 8 |
| PDE1A | JAM2 | 0.784114 | 11 | 0 | 11 |
| PDE1A | TCEAL6 | 0.781832 | 3 | 0 | 3 |
| PDE1A | LIFR | 0.780643 | 6 | 0 | 6 |
| PDE1A | RSPO3 | 0.778187 | 8 | 0 | 7 |
| PDE1A | ASPA | 0.776367 | 10 | 0 | 10 |
| PDE1A | PREX2 | 0.775873 | 5 | 0 | 4 |
For details and further investigation, click here