| Full name: protein tyrosine phosphatase receptor type T | Alias Symbol: RPTPrho|KIAA0283 | ||
| Type: protein-coding gene | Cytoband: 20q12-q13.11 | ||
| Entrez ID: 11122 | HGNC ID: HGNC:9682 | Ensembl Gene: ENSG00000196090 | OMIM ID: 608712 |
Expression of PTPRT:
| Dataset | Gene | EntrezID | Probe | Log2FC | Adj.pValue | Expression |
|---|---|---|---|---|---|---|
| GSE17351 | PTPRT | 11122 | 205948_at | -0.1705 | 0.5544 | |
| GSE20347 | PTPRT | 11122 | 205948_at | 0.0518 | 0.7033 | |
| GSE23400 | PTPRT | 11122 | 205948_at | -0.1185 | 0.0105 | |
| GSE26886 | PTPRT | 11122 | 205948_at | 0.0536 | 0.6442 | |
| GSE29001 | PTPRT | 11122 | 205948_at | -0.1133 | 0.6003 | |
| GSE38129 | PTPRT | 11122 | 205948_at | -0.0690 | 0.5507 | |
| GSE45670 | PTPRT | 11122 | 205948_at | 0.1298 | 0.2530 | |
| GSE53622 | PTPRT | 11122 | 72776 | -0.4060 | 0.0948 | |
| GSE53624 | PTPRT | 11122 | 72776 | -0.2950 | 0.1216 | |
| GSE63941 | PTPRT | 11122 | 205948_at | 0.2874 | 0.0926 | |
| GSE77861 | PTPRT | 11122 | 205948_at | 0.0272 | 0.8957 | |
| SRP159526 | PTPRT | 11122 | RNAseq | 3.1988 | 0.0039 | |
| TCGA | PTPRT | 11122 | RNAseq | -0.6260 | 0.3921 |
Upregulated datasets: 1; Downregulated datasets: 0.
Survival by PTPRT expression:
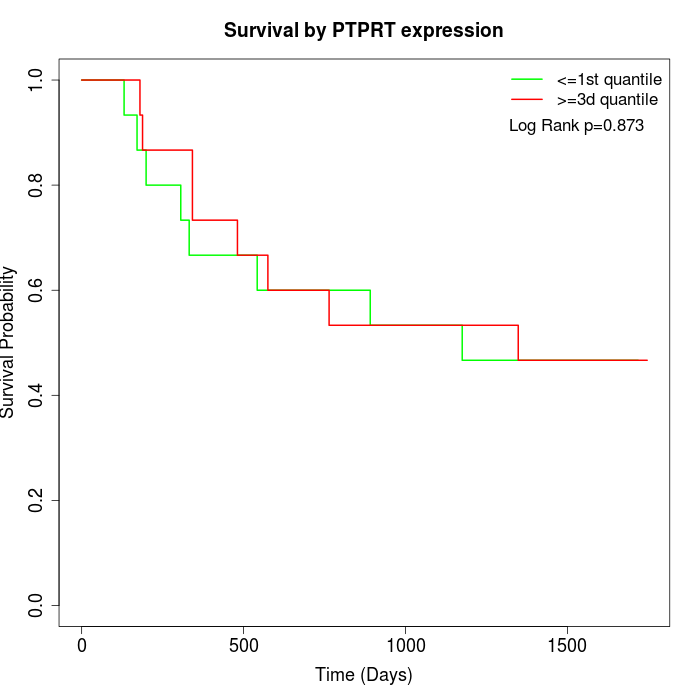 | 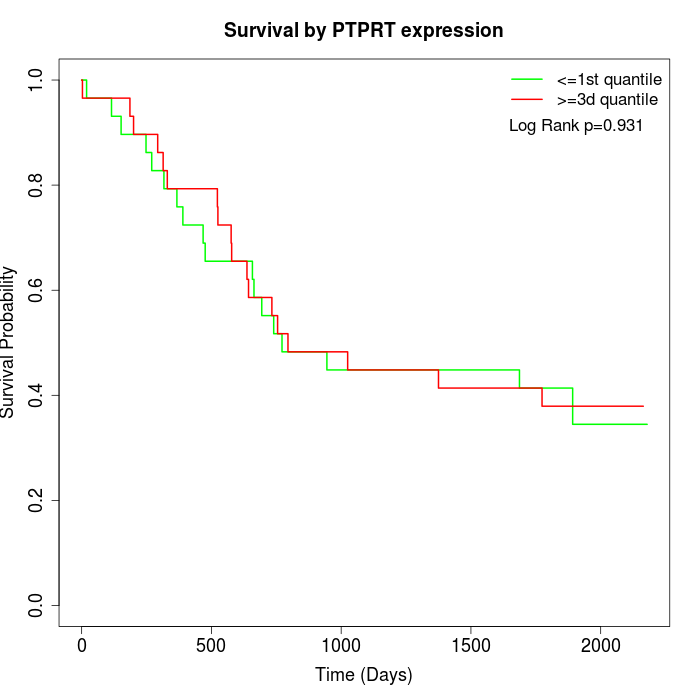 | 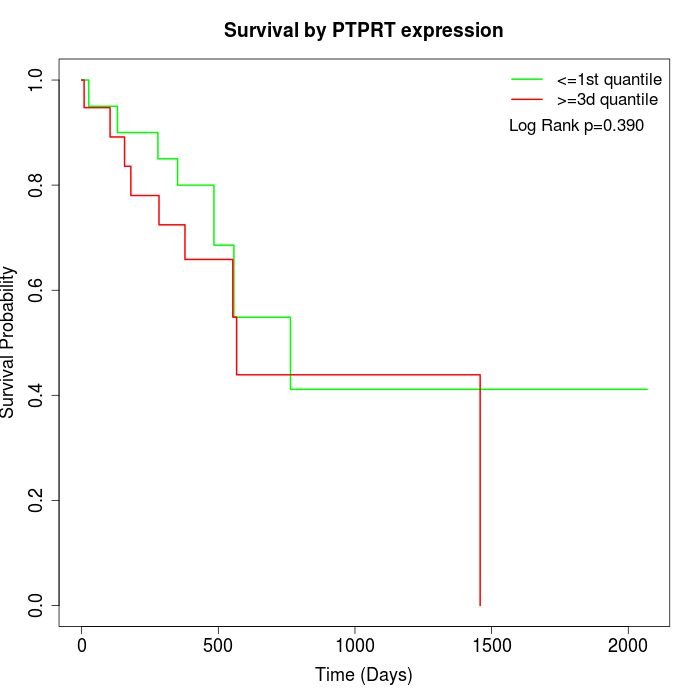 |
| GSE53622 | GSE53624 | TCGA |
Note: Click image to view full size file.
Copy number change of PTPRT:
| Dataset | Gene | EntrezID | Gain | Loss | Normal | Detail |
|---|---|---|---|---|---|---|
| GSE15526 | PTPRT | 11122 | 13 | 1 | 16 | |
| GSE20123 | PTPRT | 11122 | 13 | 1 | 16 | |
| GSE43470 | PTPRT | 11122 | 13 | 1 | 29 | |
| GSE46452 | PTPRT | 11122 | 29 | 0 | 30 | |
| GSE47630 | PTPRT | 11122 | 24 | 0 | 16 | |
| GSE54993 | PTPRT | 11122 | 0 | 17 | 53 | |
| GSE54994 | PTPRT | 11122 | 25 | 1 | 27 | |
| GSE60625 | PTPRT | 11122 | 0 | 0 | 11 | |
| GSE74703 | PTPRT | 11122 | 10 | 1 | 25 | |
| GSE74704 | PTPRT | 11122 | 9 | 0 | 11 | |
| TCGA | PTPRT | 11122 | 48 | 2 | 46 |
Total number of gains: 184; Total number of losses: 24; Total Number of normals: 280.
Somatic mutations of PTPRT:
Generating mutation plots.
Highly correlated genes for PTPRT:
Showing top 20/542 corelated genes with mean PCC>0.5.
| Gene1 | Gene2 | Mean PCC | Num. Datasets | Num. PCC<0 | Num. PCC>0.5 |
|---|---|---|---|---|---|
| PTPRT | RAB4B | 0.720042 | 3 | 0 | 3 |
| PTPRT | CSF2 | 0.674307 | 4 | 0 | 3 |
| PTPRT | RENBP | 0.671176 | 4 | 0 | 3 |
| PTPRT | KRT2 | 0.670893 | 4 | 0 | 3 |
| PTPRT | LCT | 0.666702 | 3 | 0 | 3 |
| PTPRT | RUNX1T1 | 0.661943 | 3 | 0 | 3 |
| PTPRT | SLC6A5 | 0.659302 | 4 | 0 | 4 |
| PTPRT | RFPL3 | 0.658401 | 4 | 0 | 4 |
| PTPRT | TCL6 | 0.657794 | 5 | 0 | 5 |
| PTPRT | BFSP2 | 0.652539 | 3 | 0 | 3 |
| PTPRT | PSG7 | 0.64993 | 3 | 0 | 3 |
| PTPRT | KHDRBS2 | 0.647649 | 3 | 0 | 3 |
| PTPRT | ARSE | 0.647374 | 3 | 0 | 3 |
| PTPRT | ACVR2B-AS1 | 0.646719 | 5 | 0 | 4 |
| PTPRT | TREML2 | 0.643222 | 6 | 0 | 6 |
| PTPRT | CRYGC | 0.643117 | 3 | 0 | 3 |
| PTPRT | CASR | 0.642804 | 4 | 0 | 4 |
| PTPRT | NYX | 0.641729 | 3 | 0 | 3 |
| PTPRT | TCTN2 | 0.640984 | 5 | 0 | 4 |
| PTPRT | TAS2R1 | 0.640939 | 4 | 0 | 4 |
For details and further investigation, click here