| Full name: regulator of G protein signaling 14 | Alias Symbol: | ||
| Type: protein-coding gene | Cytoband: 5q35.3 | ||
| Entrez ID: 10636 | HGNC ID: HGNC:9996 | Ensembl Gene: ENSG00000169220 | OMIM ID: 602513 |
Screen Evidence:
| |||
RGS14 involved pathways:
| KEGG pathway | Description | View |
|---|---|---|
| hsa04015 | Rap1 signaling pathway |
Expression of RGS14:
| Dataset | Gene | EntrezID | Probe | Log2FC | Adj.pValue | Expression |
|---|---|---|---|---|---|---|
| GSE17351 | RGS14 | 10636 | 38290_at | -0.3025 | 0.7140 | |
| GSE20347 | RGS14 | 10636 | 38290_at | -1.1590 | 0.0000 | |
| GSE23400 | RGS14 | 10636 | 204280_at | -0.3430 | 0.0000 | |
| GSE26886 | RGS14 | 10636 | 38290_at | -0.7375 | 0.0022 | |
| GSE29001 | RGS14 | 10636 | 38290_at | -0.8942 | 0.0002 | |
| GSE38129 | RGS14 | 10636 | 38290_at | -0.7425 | 0.0073 | |
| GSE45670 | RGS14 | 10636 | 38290_at | -0.2191 | 0.3968 | |
| GSE53622 | RGS14 | 10636 | 87364 | -0.9643 | 0.0000 | |
| GSE53624 | RGS14 | 10636 | 87364 | -1.2877 | 0.0000 | |
| GSE63941 | RGS14 | 10636 | 38290_at | 0.1694 | 0.6926 | |
| GSE77861 | RGS14 | 10636 | 38290_at | -0.6182 | 0.0046 | |
| GSE97050 | RGS14 | 10636 | A_23_P124927 | -0.1598 | 0.7359 | |
| SRP007169 | RGS14 | 10636 | RNAseq | -2.8874 | 0.0000 | |
| SRP008496 | RGS14 | 10636 | RNAseq | -2.4686 | 0.0000 | |
| SRP064894 | RGS14 | 10636 | RNAseq | -0.7944 | 0.0008 | |
| SRP133303 | RGS14 | 10636 | RNAseq | -1.2073 | 0.0000 | |
| SRP159526 | RGS14 | 10636 | RNAseq | -1.5871 | 0.0007 | |
| SRP193095 | RGS14 | 10636 | RNAseq | -0.7965 | 0.0000 | |
| SRP219564 | RGS14 | 10636 | RNAseq | -1.1030 | 0.0434 | |
| TCGA | RGS14 | 10636 | RNAseq | 0.2016 | 0.0325 |
Upregulated datasets: 0; Downregulated datasets: 7.
Survival by RGS14 expression:
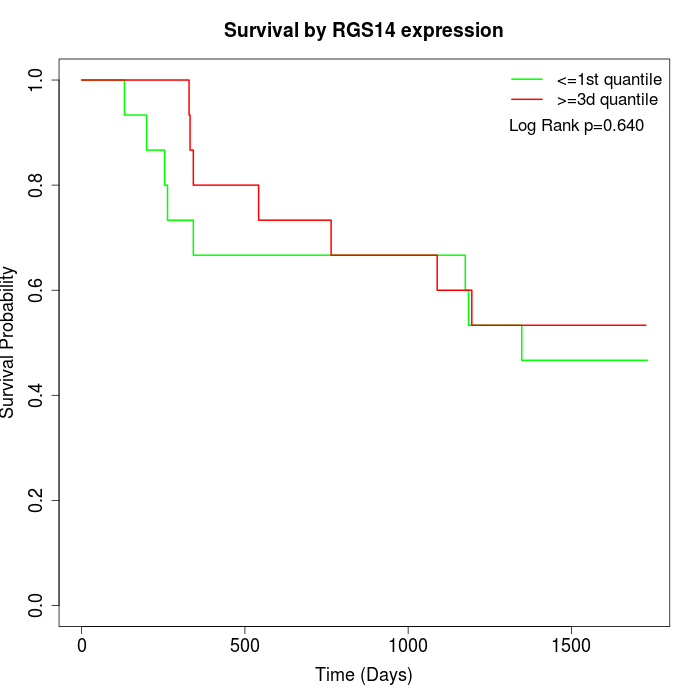 | 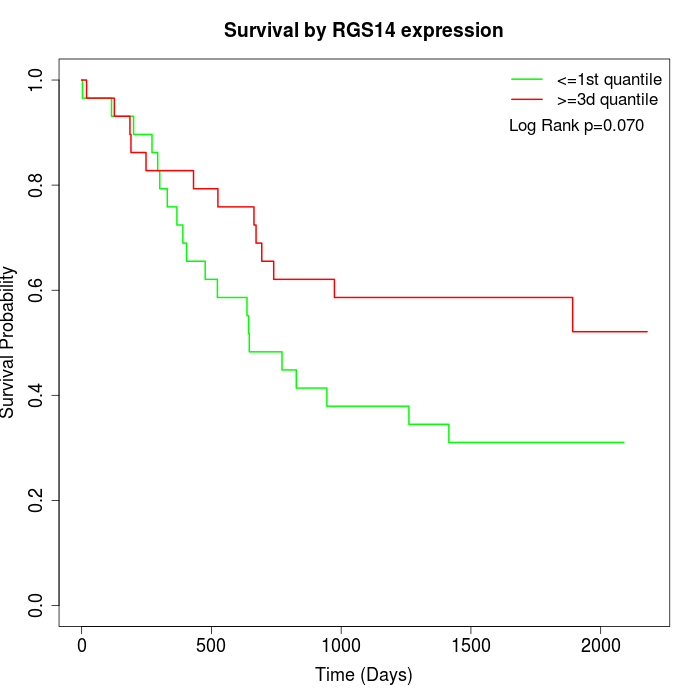 | 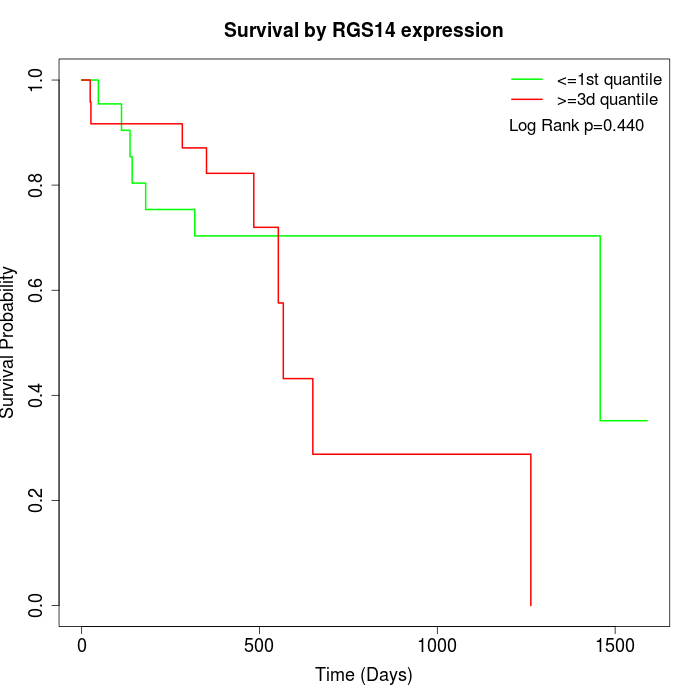 |
| GSE53622 | GSE53624 | TCGA |
Note: Click image to view full size file.
Copy number change of RGS14:
| Dataset | Gene | EntrezID | Gain | Loss | Normal | Detail |
|---|---|---|---|---|---|---|
| GSE15526 | RGS14 | 10636 | 2 | 13 | 15 | |
| GSE20123 | RGS14 | 10636 | 2 | 13 | 15 | |
| GSE43470 | RGS14 | 10636 | 1 | 11 | 31 | |
| GSE46452 | RGS14 | 10636 | 0 | 27 | 32 | |
| GSE47630 | RGS14 | 10636 | 1 | 20 | 19 | |
| GSE54993 | RGS14 | 10636 | 10 | 2 | 58 | |
| GSE54994 | RGS14 | 10636 | 2 | 17 | 34 | |
| GSE60625 | RGS14 | 10636 | 1 | 0 | 10 | |
| GSE74703 | RGS14 | 10636 | 1 | 7 | 28 | |
| GSE74704 | RGS14 | 10636 | 1 | 6 | 13 | |
| TCGA | RGS14 | 10636 | 8 | 34 | 54 |
Total number of gains: 29; Total number of losses: 150; Total Number of normals: 309.
Somatic mutations of RGS14:
Generating mutation plots.
Highly correlated genes for RGS14:
Showing top 20/1690 corelated genes with mean PCC>0.5.
| Gene1 | Gene2 | Mean PCC | Num. Datasets | Num. PCC<0 | Num. PCC>0.5 |
|---|---|---|---|---|---|
| RGS14 | MOB3C | 0.873252 | 3 | 0 | 3 |
| RGS14 | LEPROT | 0.809377 | 3 | 0 | 3 |
| RGS14 | ANKRD31 | 0.777333 | 4 | 0 | 4 |
| RGS14 | EPGN | 0.776483 | 3 | 0 | 3 |
| RGS14 | COX15 | 0.775234 | 3 | 0 | 3 |
| RGS14 | DDI2 | 0.773152 | 3 | 0 | 3 |
| RGS14 | ZNF449 | 0.768635 | 3 | 0 | 3 |
| RGS14 | CRABP2 | 0.764304 | 9 | 0 | 9 |
| RGS14 | MTPN | 0.762447 | 4 | 0 | 4 |
| RGS14 | KDM3B | 0.75726 | 3 | 0 | 3 |
| RGS14 | GRN | 0.754146 | 8 | 0 | 8 |
| RGS14 | ZCCHC9 | 0.75273 | 3 | 0 | 3 |
| RGS14 | NIPAL1 | 0.751491 | 3 | 0 | 3 |
| RGS14 | LACTBL1 | 0.745122 | 3 | 0 | 3 |
| RGS14 | EVPL | 0.743706 | 10 | 0 | 10 |
| RGS14 | SLC16A6 | 0.740924 | 10 | 0 | 10 |
| RGS14 | ENSA | 0.736741 | 11 | 0 | 11 |
| RGS14 | TOM1 | 0.733198 | 10 | 0 | 9 |
| RGS14 | C6orf132 | 0.731494 | 6 | 0 | 6 |
| RGS14 | COMTD1 | 0.729924 | 7 | 0 | 6 |
For details and further investigation, click here