| Full name: target of myb1 membrane trafficking protein | Alias Symbol: | ||
| Type: protein-coding gene | Cytoband: 22q12.3 | ||
| Entrez ID: 10043 | HGNC ID: HGNC:11982 | Ensembl Gene: ENSG00000100284 | OMIM ID: 604700 |
Expression of TOM1:
| Dataset | Gene | EntrezID | Probe | Log2FC | Adj.pValue | Expression |
|---|---|---|---|---|---|---|
| GSE17351 | TOM1 | 10043 | 202807_s_at | -0.8323 | 0.1978 | |
| GSE20347 | TOM1 | 10043 | 202807_s_at | -1.3321 | 0.0000 | |
| GSE23400 | TOM1 | 10043 | 202807_s_at | -0.8953 | 0.0000 | |
| GSE26886 | TOM1 | 10043 | 202807_s_at | -2.2167 | 0.0000 | |
| GSE29001 | TOM1 | 10043 | 202807_s_at | -1.2400 | 0.0001 | |
| GSE38129 | TOM1 | 10043 | 202807_s_at | -0.9363 | 0.0000 | |
| GSE45670 | TOM1 | 10043 | 202807_s_at | -0.2760 | 0.1454 | |
| GSE53622 | TOM1 | 10043 | 94505 | -1.1726 | 0.0000 | |
| GSE53624 | TOM1 | 10043 | 94505 | -1.1675 | 0.0000 | |
| GSE63941 | TOM1 | 10043 | 202807_s_at | -0.3313 | 0.5151 | |
| GSE77861 | TOM1 | 10043 | 202807_s_at | -0.7773 | 0.0140 | |
| GSE97050 | TOM1 | 10043 | A_33_P3751889 | -0.1030 | 0.8428 | |
| SRP007169 | TOM1 | 10043 | RNAseq | -2.3237 | 0.0000 | |
| SRP008496 | TOM1 | 10043 | RNAseq | -2.3668 | 0.0000 | |
| SRP064894 | TOM1 | 10043 | RNAseq | -1.1381 | 0.0000 | |
| SRP133303 | TOM1 | 10043 | RNAseq | -1.3133 | 0.0000 | |
| SRP159526 | TOM1 | 10043 | RNAseq | -1.5320 | 0.0000 | |
| SRP193095 | TOM1 | 10043 | RNAseq | -1.4222 | 0.0000 | |
| SRP219564 | TOM1 | 10043 | RNAseq | -0.8003 | 0.1301 | |
| TCGA | TOM1 | 10043 | RNAseq | 0.0431 | 0.4977 |
Upregulated datasets: 0; Downregulated datasets: 11.
Survival by TOM1 expression:
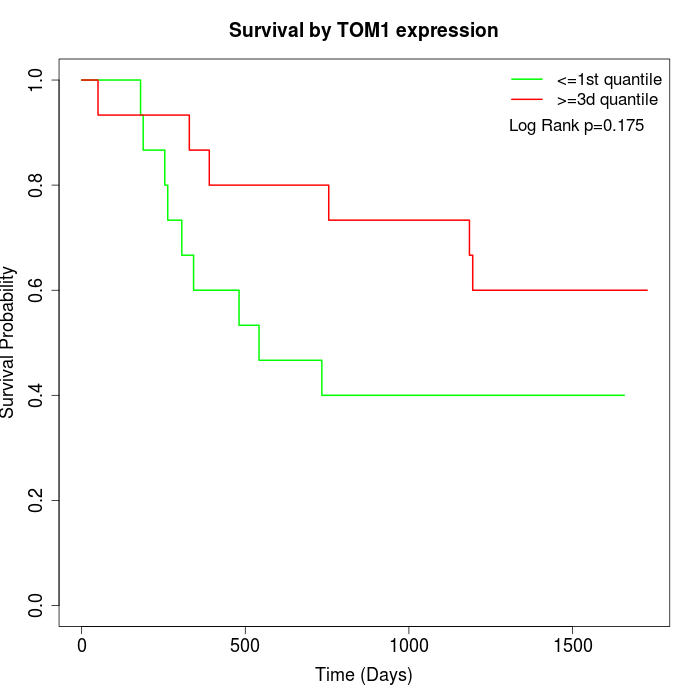 | 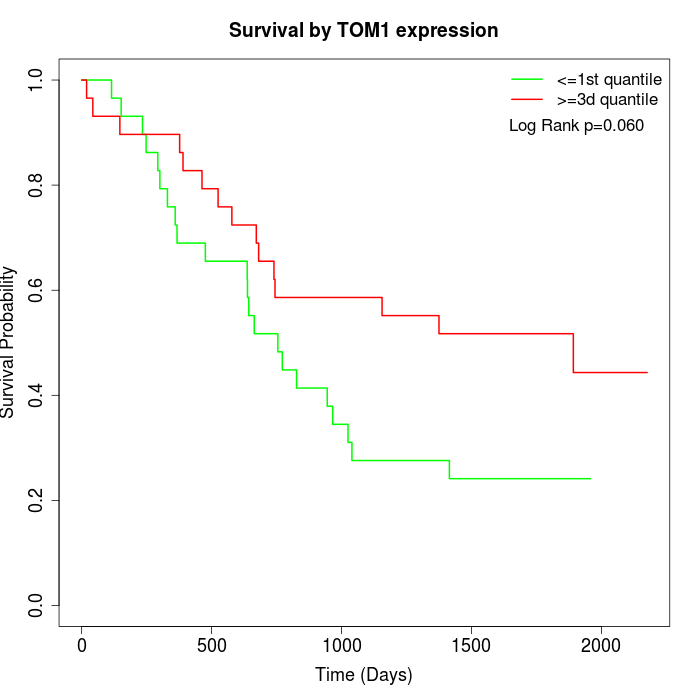 | 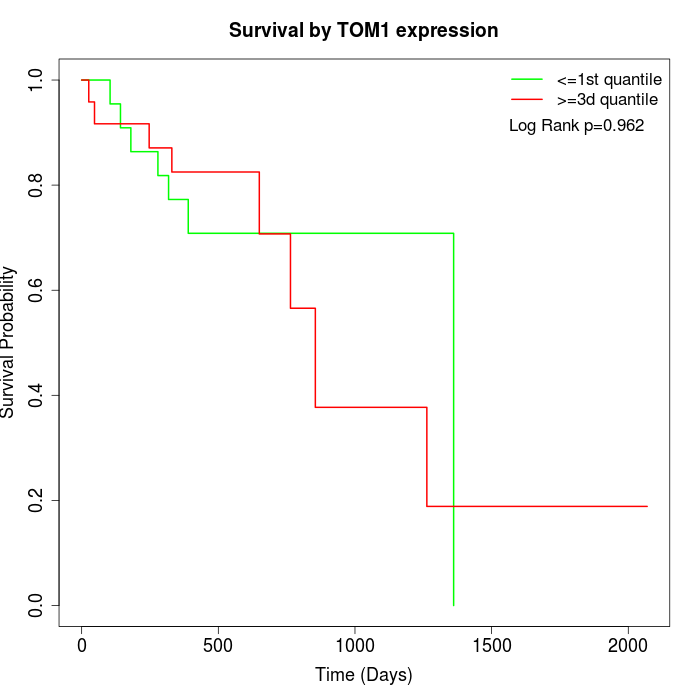 |
| GSE53622 | GSE53624 | TCGA |
Note: Click image to view full size file.
Copy number change of TOM1:
| Dataset | Gene | EntrezID | Gain | Loss | Normal | Detail |
|---|---|---|---|---|---|---|
| GSE15526 | TOM1 | 10043 | 4 | 6 | 20 | |
| GSE20123 | TOM1 | 10043 | 4 | 5 | 21 | |
| GSE43470 | TOM1 | 10043 | 4 | 7 | 32 | |
| GSE46452 | TOM1 | 10043 | 31 | 1 | 27 | |
| GSE47630 | TOM1 | 10043 | 8 | 5 | 27 | |
| GSE54993 | TOM1 | 10043 | 3 | 6 | 61 | |
| GSE54994 | TOM1 | 10043 | 9 | 9 | 35 | |
| GSE60625 | TOM1 | 10043 | 5 | 0 | 6 | |
| GSE74703 | TOM1 | 10043 | 4 | 5 | 27 | |
| GSE74704 | TOM1 | 10043 | 1 | 2 | 17 | |
| TCGA | TOM1 | 10043 | 27 | 15 | 54 |
Total number of gains: 100; Total number of losses: 61; Total Number of normals: 327.
Somatic mutations of TOM1:
Generating mutation plots.
Highly correlated genes for TOM1:
Showing top 20/1832 corelated genes with mean PCC>0.5.
| Gene1 | Gene2 | Mean PCC | Num. Datasets | Num. PCC<0 | Num. PCC>0.5 |
|---|---|---|---|---|---|
| TOM1 | VSIG10L | 0.872827 | 6 | 0 | 6 |
| TOM1 | SCNN1B | 0.862671 | 10 | 0 | 10 |
| TOM1 | EVPL | 0.851265 | 11 | 0 | 11 |
| TOM1 | ARHGAP27 | 0.847638 | 7 | 0 | 7 |
| TOM1 | SLC16A6 | 0.84293 | 11 | 0 | 11 |
| TOM1 | SH3GL1 | 0.841172 | 12 | 0 | 11 |
| TOM1 | TECR | 0.839675 | 10 | 0 | 10 |
| TOM1 | MPZL3 | 0.836975 | 7 | 0 | 7 |
| TOM1 | SNX24 | 0.835801 | 10 | 0 | 10 |
| TOM1 | PLEKHM1 | 0.834687 | 12 | 0 | 11 |
| TOM1 | ECM1 | 0.834511 | 11 | 0 | 11 |
| TOM1 | IL36A | 0.833736 | 10 | 0 | 10 |
| TOM1 | PADI1 | 0.831394 | 8 | 0 | 8 |
| TOM1 | WDFY1 | 0.830426 | 3 | 0 | 3 |
| TOM1 | ENDOU | 0.828651 | 11 | 0 | 11 |
| TOM1 | UPK1A | 0.827332 | 10 | 0 | 10 |
| TOM1 | SULT2B1 | 0.82705 | 9 | 0 | 8 |
| TOM1 | CRCT1 | 0.823432 | 11 | 0 | 11 |
| TOM1 | MXD1 | 0.822248 | 11 | 0 | 10 |
| TOM1 | PDLIM2 | 0.820026 | 9 | 0 | 9 |
For details and further investigation, click here