| Full name: secretin receptor | Alias Symbol: | ||
| Type: protein-coding gene | Cytoband: 2q14.2 | ||
| Entrez ID: 6344 | HGNC ID: HGNC:10608 | Ensembl Gene: ENSG00000080293 | OMIM ID: 182098 |
| Related drugs: CHEMBL525028, SECRETIN, SECRETIN SYNTHETIC HUMAN, SECRETIN SYNTHETIC PORCINE... [more] | |||
SCTR involved pathways:
| KEGG pathway | Description | View |
|---|---|---|
| hsa04972 | Pancreatic secretion | |
| hsa04976 | Bile secretion |
Expression of SCTR:
| Dataset | Gene | EntrezID | Probe | Log2FC | Adj.pValue | Expression |
|---|---|---|---|---|---|---|
| GSE17351 | SCTR | 6344 | 210382_at | -0.2454 | 0.2698 | |
| GSE20347 | SCTR | 6344 | 210382_at | -0.1301 | 0.1380 | |
| GSE23400 | SCTR | 6344 | 210382_at | -0.1762 | 0.0000 | |
| GSE26886 | SCTR | 6344 | 210382_at | 0.0242 | 0.8788 | |
| GSE29001 | SCTR | 6344 | 210382_at | -0.1268 | 0.5213 | |
| GSE38129 | SCTR | 6344 | 210382_at | -0.2418 | 0.0307 | |
| GSE45670 | SCTR | 6344 | 210382_at | 0.0049 | 0.9615 | |
| GSE53622 | SCTR | 6344 | 163341 | -0.2603 | 0.0549 | |
| GSE53624 | SCTR | 6344 | 163341 | -0.3106 | 0.0203 | |
| GSE63941 | SCTR | 6344 | 210382_at | 0.0024 | 0.9885 | |
| GSE77861 | SCTR | 6344 | 210382_at | -0.0972 | 0.4096 | |
| GSE97050 | SCTR | 6344 | A_23_P28139 | -0.1048 | 0.7681 | |
| TCGA | SCTR | 6344 | RNAseq | -4.2121 | 0.0000 |
Upregulated datasets: 0; Downregulated datasets: 1.
Survival by SCTR expression:
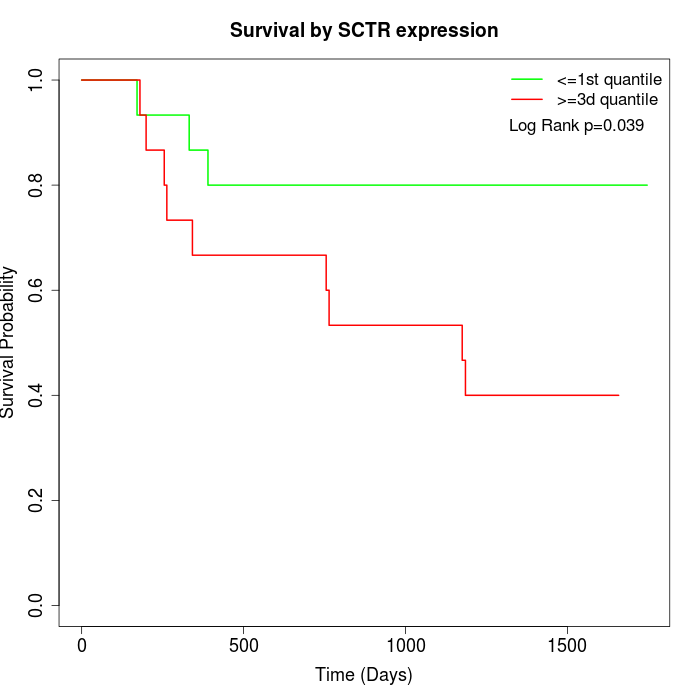 | 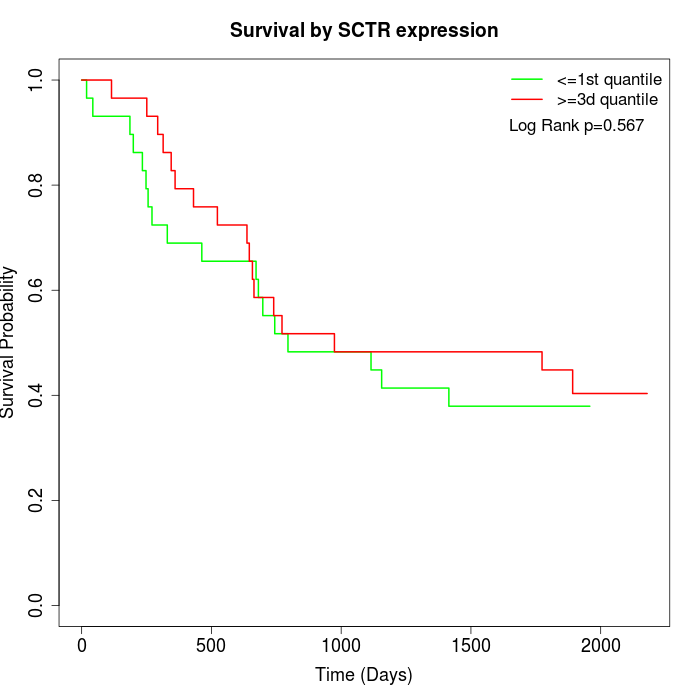 | 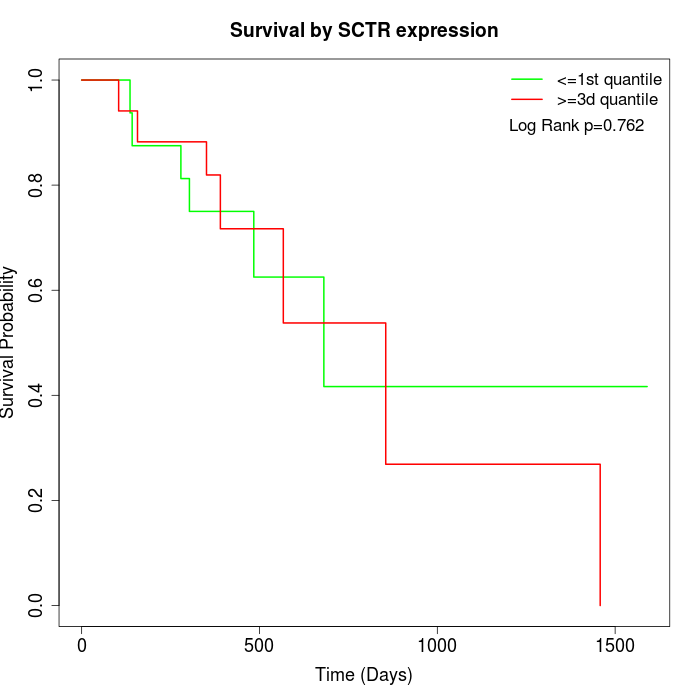 |
| GSE53622 | GSE53624 | TCGA |
Note: Click image to view full size file.
Copy number change of SCTR:
| Dataset | Gene | EntrezID | Gain | Loss | Normal | Detail |
|---|---|---|---|---|---|---|
| GSE15526 | SCTR | 6344 | 6 | 2 | 22 | |
| GSE20123 | SCTR | 6344 | 6 | 2 | 22 | |
| GSE43470 | SCTR | 6344 | 3 | 1 | 39 | |
| GSE46452 | SCTR | 6344 | 1 | 4 | 54 | |
| GSE47630 | SCTR | 6344 | 6 | 0 | 34 | |
| GSE54993 | SCTR | 6344 | 0 | 6 | 64 | |
| GSE54994 | SCTR | 6344 | 12 | 0 | 41 | |
| GSE60625 | SCTR | 6344 | 0 | 3 | 8 | |
| GSE74703 | SCTR | 6344 | 3 | 1 | 32 | |
| GSE74704 | SCTR | 6344 | 3 | 1 | 16 | |
| TCGA | SCTR | 6344 | 32 | 6 | 58 |
Total number of gains: 72; Total number of losses: 26; Total Number of normals: 390.
Somatic mutations of SCTR:
Generating mutation plots.
Highly correlated genes for SCTR:
Showing top 20/1074 corelated genes with mean PCC>0.5.
| Gene1 | Gene2 | Mean PCC | Num. Datasets | Num. PCC<0 | Num. PCC>0.5 |
|---|---|---|---|---|---|
| SCTR | TOM1L2 | 0.727861 | 5 | 0 | 5 |
| SCTR | KRTAP10-12 | 0.713083 | 3 | 0 | 3 |
| SCTR | IRS4 | 0.712466 | 4 | 0 | 4 |
| SCTR | RHAG | 0.705217 | 4 | 0 | 4 |
| SCTR | SSMEM1 | 0.70467 | 3 | 0 | 3 |
| SCTR | GJB4 | 0.691578 | 7 | 0 | 7 |
| SCTR | MAP1A | 0.68883 | 3 | 0 | 3 |
| SCTR | EPS8L3 | 0.688619 | 5 | 0 | 5 |
| SCTR | KSR1 | 0.687581 | 5 | 0 | 5 |
| SCTR | CYLC1 | 0.686973 | 4 | 0 | 4 |
| SCTR | S100G | 0.682086 | 4 | 0 | 3 |
| SCTR | NPAP1 | 0.680314 | 4 | 0 | 4 |
| SCTR | AMELY | 0.680311 | 4 | 0 | 4 |
| SCTR | UMOD | 0.678871 | 5 | 0 | 5 |
| SCTR | OCM2 | 0.672573 | 3 | 0 | 3 |
| SCTR | KRTAP5-7 | 0.669207 | 3 | 0 | 3 |
| SCTR | LINC00163 | 0.668326 | 3 | 0 | 3 |
| SCTR | CIITA | 0.66688 | 6 | 0 | 6 |
| SCTR | TMPRSS2 | 0.665222 | 3 | 0 | 3 |
| SCTR | COLEC10 | 0.665161 | 3 | 0 | 3 |
For details and further investigation, click here