| Full name: target of myb1 like 2 membrane trafficking protein | Alias Symbol: | ||
| Type: protein-coding gene | Cytoband: 17p11.2 | ||
| Entrez ID: 146691 | HGNC ID: HGNC:11984 | Ensembl Gene: ENSG00000175662 | OMIM ID: 615519 |
Expression of TOM1L2:
| Dataset | Gene | EntrezID | Probe | Log2FC | Adj.pValue | Expression |
|---|---|---|---|---|---|---|
| GSE17351 | TOM1L2 | 146691 | 226198_at | -0.5288 | 0.2551 | |
| GSE20347 | TOM1L2 | 146691 | 214840_at | -0.2211 | 0.0236 | |
| GSE23400 | TOM1L2 | 146691 | 214840_at | -0.3848 | 0.0000 | |
| GSE26886 | TOM1L2 | 146691 | 226198_at | -1.7020 | 0.0000 | |
| GSE29001 | TOM1L2 | 146691 | 214840_at | -0.1937 | 0.2309 | |
| GSE38129 | TOM1L2 | 146691 | 214840_at | -0.2960 | 0.0039 | |
| GSE45670 | TOM1L2 | 146691 | 226198_at | -0.5315 | 0.0207 | |
| GSE53622 | TOM1L2 | 146691 | 158744 | -1.6668 | 0.0000 | |
| GSE53624 | TOM1L2 | 146691 | 158744 | -1.5342 | 0.0000 | |
| GSE63941 | TOM1L2 | 146691 | 226198_at | -0.1788 | 0.7879 | |
| GSE77861 | TOM1L2 | 146691 | 226198_at | -0.6459 | 0.0039 | |
| GSE97050 | TOM1L2 | 146691 | A_23_P141180 | -1.0569 | 0.1204 | |
| SRP007169 | TOM1L2 | 146691 | RNAseq | -1.7319 | 0.0030 | |
| SRP008496 | TOM1L2 | 146691 | RNAseq | -1.5690 | 0.0000 | |
| SRP064894 | TOM1L2 | 146691 | RNAseq | -1.4228 | 0.0000 | |
| SRP133303 | TOM1L2 | 146691 | RNAseq | -1.3330 | 0.0000 | |
| SRP159526 | TOM1L2 | 146691 | RNAseq | -1.5590 | 0.0000 | |
| SRP193095 | TOM1L2 | 146691 | RNAseq | -1.2048 | 0.0000 | |
| SRP219564 | TOM1L2 | 146691 | RNAseq | -1.3566 | 0.0001 | |
| TCGA | TOM1L2 | 146691 | RNAseq | -0.3170 | 0.0000 |
Upregulated datasets: 0; Downregulated datasets: 10.
Survival by TOM1L2 expression:
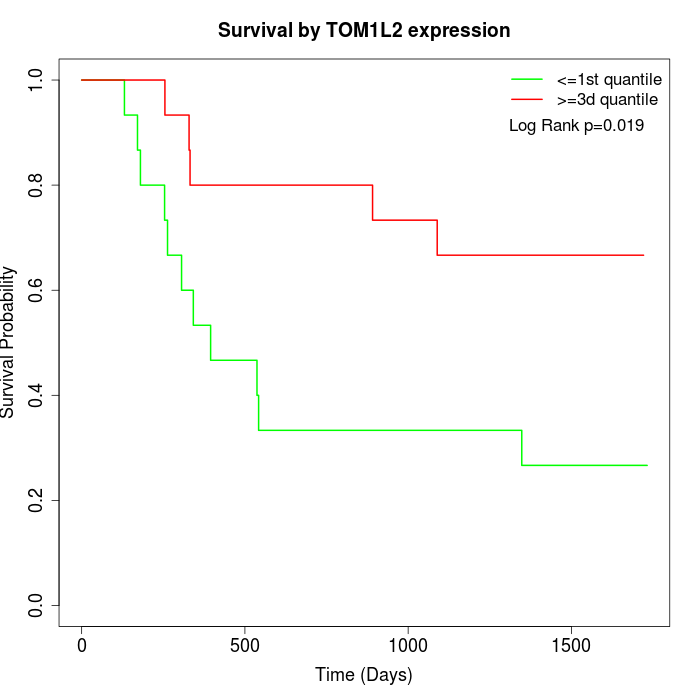 | 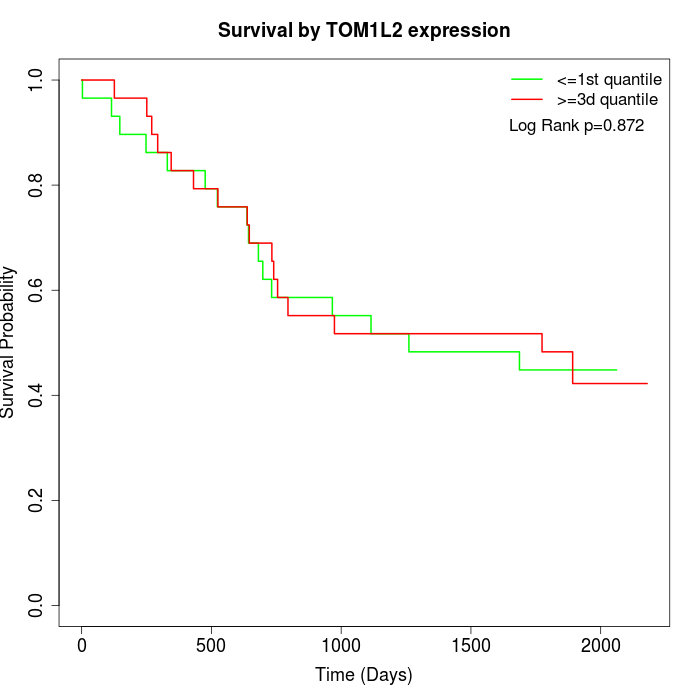 | 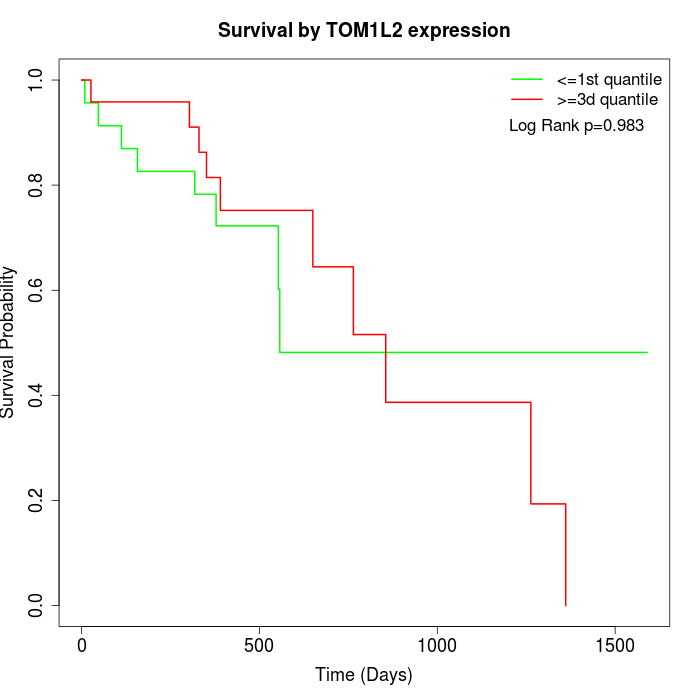 |
| GSE53622 | GSE53624 | TCGA |
Note: Click image to view full size file.
Copy number change of TOM1L2:
| Dataset | Gene | EntrezID | Gain | Loss | Normal | Detail |
|---|---|---|---|---|---|---|
| GSE15526 | TOM1L2 | 146691 | 3 | 3 | 24 | |
| GSE20123 | TOM1L2 | 146691 | 3 | 4 | 23 | |
| GSE43470 | TOM1L2 | 146691 | 1 | 5 | 37 | |
| GSE46452 | TOM1L2 | 146691 | 34 | 1 | 24 | |
| GSE47630 | TOM1L2 | 146691 | 7 | 1 | 32 | |
| GSE54993 | TOM1L2 | 146691 | 3 | 3 | 64 | |
| GSE54994 | TOM1L2 | 146691 | 6 | 6 | 41 | |
| GSE60625 | TOM1L2 | 146691 | 4 | 0 | 7 | |
| GSE74703 | TOM1L2 | 146691 | 1 | 2 | 33 | |
| GSE74704 | TOM1L2 | 146691 | 2 | 1 | 17 | |
| TCGA | TOM1L2 | 146691 | 18 | 23 | 55 |
Total number of gains: 82; Total number of losses: 49; Total Number of normals: 357.
Somatic mutations of TOM1L2:
Generating mutation plots.
Highly correlated genes for TOM1L2:
Showing top 20/1799 corelated genes with mean PCC>0.5.
| Gene1 | Gene2 | Mean PCC | Num. Datasets | Num. PCC<0 | Num. PCC>0.5 |
|---|---|---|---|---|---|
| TOM1L2 | MYZAP | 0.821477 | 3 | 0 | 3 |
| TOM1L2 | C6orf132 | 0.815145 | 6 | 0 | 6 |
| TOM1L2 | CASC3 | 0.783329 | 3 | 0 | 3 |
| TOM1L2 | STRADB | 0.780265 | 7 | 0 | 7 |
| TOM1L2 | SH3BGRL2 | 0.780169 | 7 | 0 | 7 |
| TOM1L2 | KRT78 | 0.766747 | 7 | 0 | 7 |
| TOM1L2 | ZNF503-AS1 | 0.766095 | 6 | 0 | 6 |
| TOM1L2 | MPP7 | 0.766024 | 7 | 0 | 7 |
| TOM1L2 | PRSS27 | 0.764246 | 6 | 0 | 6 |
| TOM1L2 | TMEM154 | 0.759112 | 6 | 0 | 6 |
| TOM1L2 | S100A16 | 0.758767 | 6 | 0 | 6 |
| TOM1L2 | C5orf66-AS1 | 0.754176 | 6 | 0 | 6 |
| TOM1L2 | CYSRT1 | 0.751594 | 6 | 0 | 6 |
| TOM1L2 | ULK3 | 0.750543 | 7 | 0 | 7 |
| TOM1L2 | HCG22 | 0.748667 | 6 | 0 | 6 |
| TOM1L2 | SNORA68 | 0.744644 | 4 | 0 | 4 |
| TOM1L2 | C19orf33 | 0.743309 | 5 | 0 | 5 |
| TOM1L2 | TRNP1 | 0.742999 | 7 | 0 | 7 |
| TOM1L2 | TP53INP2 | 0.742753 | 7 | 0 | 7 |
| TOM1L2 | ZNF662 | 0.739738 | 7 | 0 | 7 |
For details and further investigation, click here