| Full name: stress associated endoplasmic reticulum protein family member 2 | Alias Symbol: bA269C23.1 | ||
| Type: protein-coding gene | Cytoband: 13q14.11 | ||
| Entrez ID: 387923 | HGNC ID: HGNC:20607 | Ensembl Gene: ENSG00000151778 | OMIM ID: |
Expression of SERP2:
| Dataset | Gene | EntrezID | Probe | Log2FC | Adj.pValue | Expression |
|---|---|---|---|---|---|---|
| GSE17351 | SERP2 | 387923 | 1558727_at | -0.0812 | 0.7034 | |
| GSE26886 | SERP2 | 387923 | 1558727_at | -0.1488 | 0.1241 | |
| GSE45670 | SERP2 | 387923 | 1558727_at | -0.0120 | 0.8872 | |
| GSE53622 | SERP2 | 387923 | 42469 | -1.4855 | 0.0000 | |
| GSE53624 | SERP2 | 387923 | 42469 | -1.8566 | 0.0000 | |
| GSE63941 | SERP2 | 387923 | 1558727_at | 0.0517 | 0.7820 | |
| GSE77861 | SERP2 | 387923 | 1558727_at | -0.1016 | 0.2752 | |
| GSE97050 | SERP2 | 387923 | A_23_P139965 | -0.2685 | 0.6629 | |
| SRP064894 | SERP2 | 387923 | RNAseq | -0.3174 | 0.4733 | |
| SRP133303 | SERP2 | 387923 | RNAseq | -1.2719 | 0.0211 | |
| SRP159526 | SERP2 | 387923 | RNAseq | -0.4546 | 0.4625 | |
| SRP219564 | SERP2 | 387923 | RNAseq | -0.9331 | 0.3699 | |
| TCGA | SERP2 | 387923 | RNAseq | -1.3705 | 0.0005 |
Upregulated datasets: 0; Downregulated datasets: 4.
Survival by SERP2 expression:
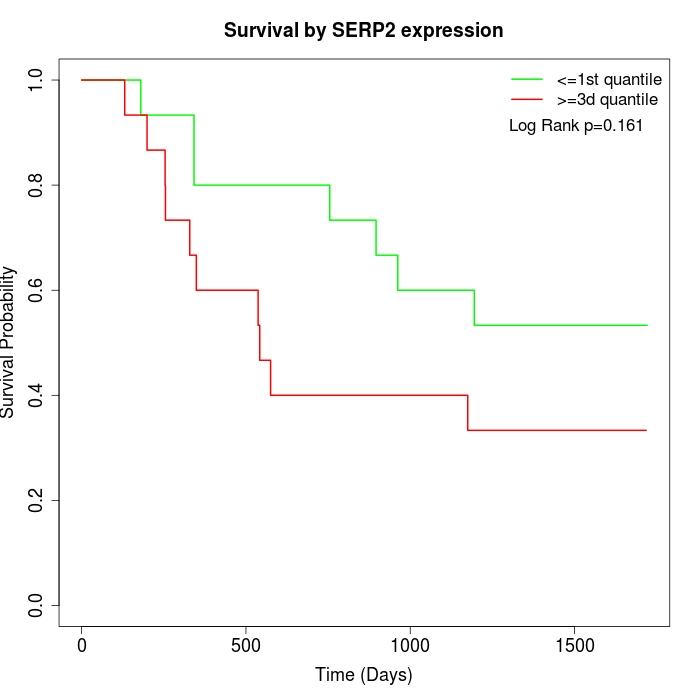 | 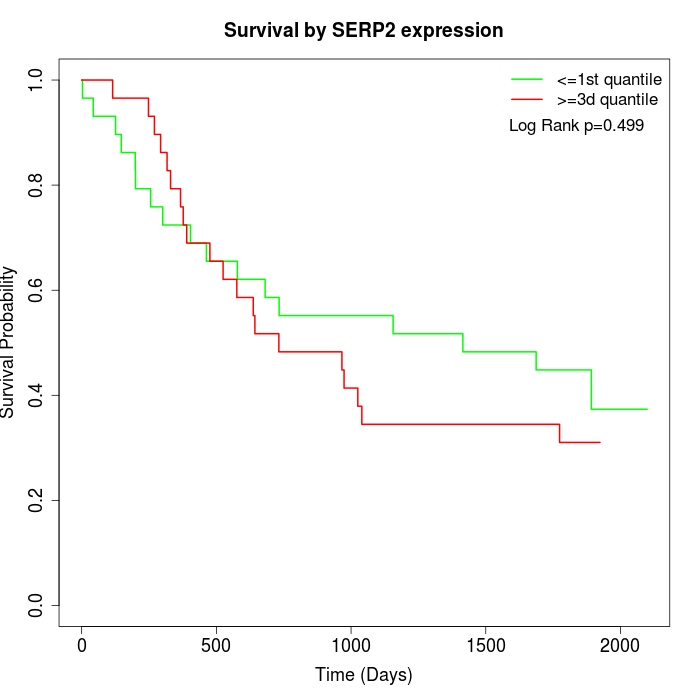 | 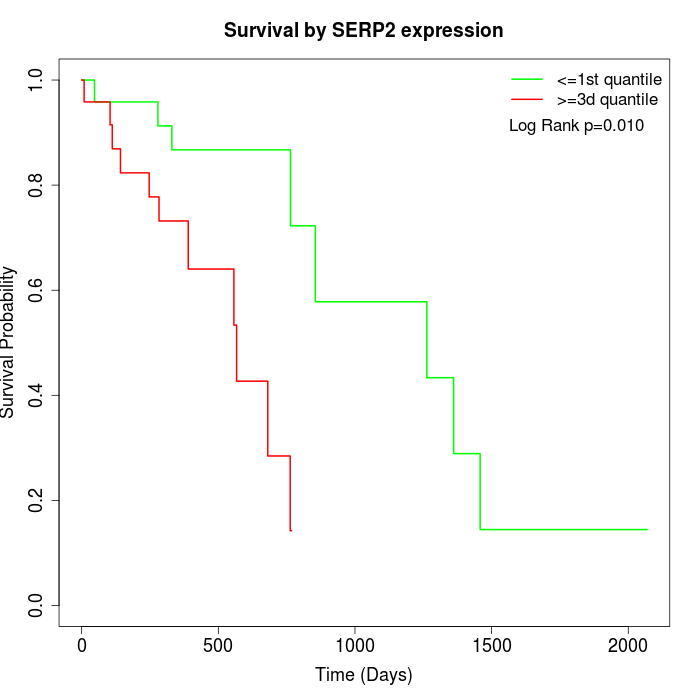 |
| GSE53622 | GSE53624 | TCGA |
Note: Click image to view full size file.
Copy number change of SERP2:
| Dataset | Gene | EntrezID | Gain | Loss | Normal | Detail |
|---|---|---|---|---|---|---|
| GSE15526 | SERP2 | 387923 | 0 | 13 | 17 | |
| GSE20123 | SERP2 | 387923 | 0 | 12 | 18 | |
| GSE43470 | SERP2 | 387923 | 3 | 13 | 27 | |
| GSE46452 | SERP2 | 387923 | 0 | 33 | 26 | |
| GSE47630 | SERP2 | 387923 | 2 | 27 | 11 | |
| GSE54993 | SERP2 | 387923 | 12 | 2 | 56 | |
| GSE54994 | SERP2 | 387923 | 1 | 16 | 36 | |
| GSE60625 | SERP2 | 387923 | 0 | 3 | 8 | |
| GSE74703 | SERP2 | 387923 | 3 | 10 | 23 | |
| GSE74704 | SERP2 | 387923 | 0 | 9 | 11 | |
| TCGA | SERP2 | 387923 | 8 | 39 | 49 |
Total number of gains: 29; Total number of losses: 177; Total Number of normals: 282.
Somatic mutations of SERP2:
Generating mutation plots.
Highly correlated genes for SERP2:
Showing top 20/338 corelated genes with mean PCC>0.5.
| Gene1 | Gene2 | Mean PCC | Num. Datasets | Num. PCC<0 | Num. PCC>0.5 |
|---|---|---|---|---|---|
| SERP2 | UBL3 | 0.701564 | 3 | 0 | 3 |
| SERP2 | RANBP9 | 0.697582 | 3 | 0 | 3 |
| SERP2 | SERPINB6 | 0.681272 | 3 | 0 | 3 |
| SERP2 | NUCB2 | 0.674129 | 3 | 0 | 3 |
| SERP2 | C9orf47 | 0.672185 | 3 | 0 | 3 |
| SERP2 | GABRA5 | 0.672038 | 3 | 0 | 3 |
| SERP2 | ARHGEF10L | 0.664014 | 4 | 0 | 4 |
| SERP2 | IL12A | 0.663748 | 3 | 0 | 3 |
| SERP2 | SASH1 | 0.663366 | 3 | 0 | 3 |
| SERP2 | GJC2 | 0.661644 | 4 | 0 | 3 |
| SERP2 | MYL3 | 0.660656 | 3 | 0 | 3 |
| SERP2 | RBFOX3 | 0.657075 | 3 | 0 | 3 |
| SERP2 | POU6F1 | 0.656556 | 4 | 0 | 3 |
| SERP2 | PPDPF | 0.65514 | 3 | 0 | 3 |
| SERP2 | KIAA1211L | 0.654079 | 3 | 0 | 3 |
| SERP2 | PTPN22 | 0.650588 | 3 | 0 | 3 |
| SERP2 | SHOX | 0.647402 | 3 | 0 | 3 |
| SERP2 | PHACTR4 | 0.646995 | 3 | 0 | 3 |
| SERP2 | CLINT1 | 0.643504 | 3 | 0 | 3 |
| SERP2 | GYS2 | 0.640063 | 3 | 0 | 3 |
For details and further investigation, click here