| Full name: myosin light chain 3 | Alias Symbol: CMH8|VLC1|MLC1V|MLC1SB | ||
| Type: protein-coding gene | Cytoband: 3p21.31 | ||
| Entrez ID: 4634 | HGNC ID: HGNC:7584 | Ensembl Gene: ENSG00000160808 | OMIM ID: 160790 |
| Related drugs: OMECAMTIV MECARBIL... [more] | |||
MYL3 involved pathways:
| KEGG pathway | Description | View |
|---|---|---|
| hsa04261 | Adrenergic signaling in cardiomyocytes |
Expression of MYL3:
| Dataset | Gene | EntrezID | Probe | Log2FC | Adj.pValue | Expression |
|---|---|---|---|---|---|---|
| GSE17351 | MYL3 | 4634 | 205589_at | -0.1905 | 0.5174 | |
| GSE20347 | MYL3 | 4634 | 205589_at | -0.0654 | 0.4491 | |
| GSE23400 | MYL3 | 4634 | 205589_at | -0.2065 | 0.0000 | |
| GSE26886 | MYL3 | 4634 | 205589_at | -0.0318 | 0.8535 | |
| GSE29001 | MYL3 | 4634 | 205589_at | -0.2523 | 0.1036 | |
| GSE38129 | MYL3 | 4634 | 205589_at | -0.1021 | 0.1092 | |
| GSE45670 | MYL3 | 4634 | 205589_at | 0.0411 | 0.7633 | |
| GSE53622 | MYL3 | 4634 | 18810 | -0.1680 | 0.0939 | |
| GSE53624 | MYL3 | 4634 | 18810 | -0.2416 | 0.0006 | |
| GSE63941 | MYL3 | 4634 | 205589_at | -0.0239 | 0.8989 | |
| GSE77861 | MYL3 | 4634 | 205589_at | -0.2878 | 0.0532 | |
| GSE97050 | MYL3 | 4634 | A_24_P131646 | -1.4098 | 0.1734 | |
| TCGA | MYL3 | 4634 | RNAseq | -2.4666 | 0.0073 |
Upregulated datasets: 0; Downregulated datasets: 1.
Survival by MYL3 expression:
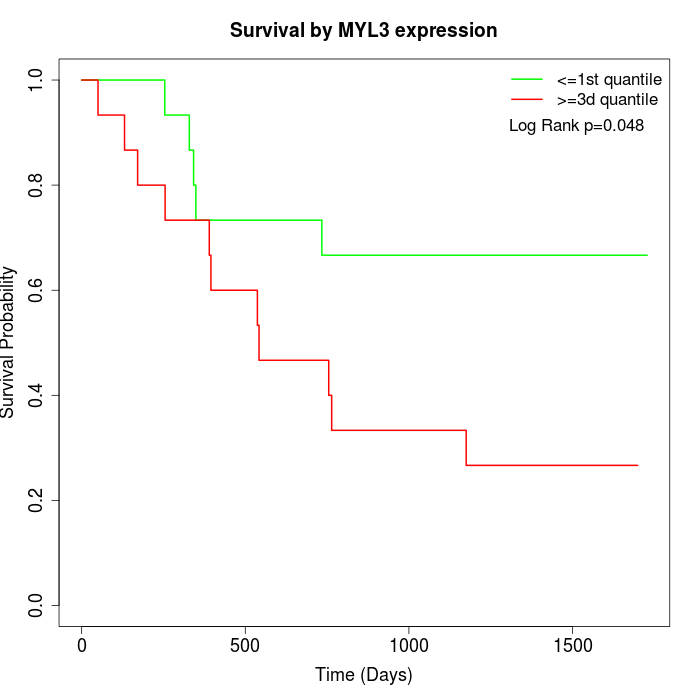 | 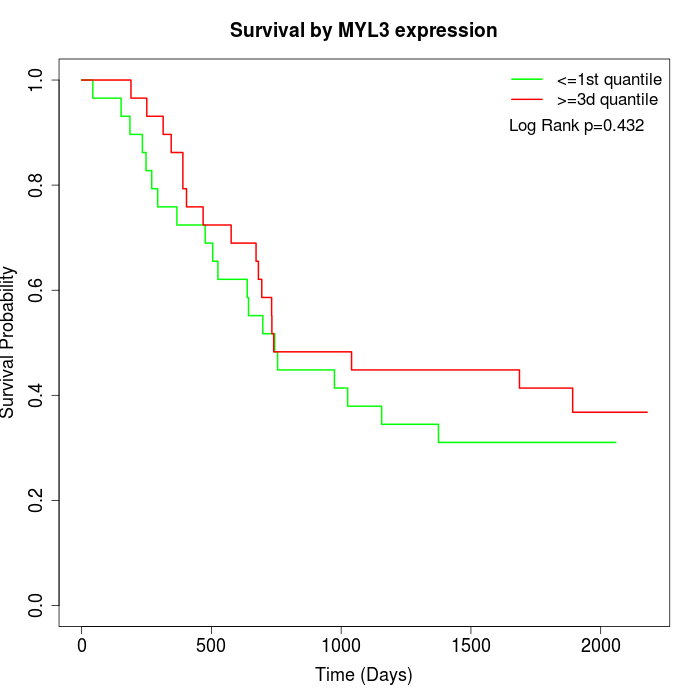 | 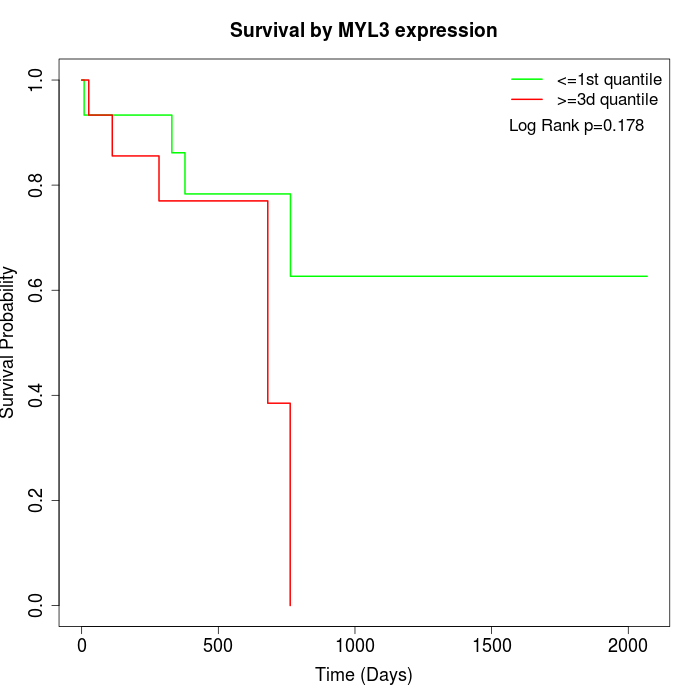 |
| GSE53622 | GSE53624 | TCGA |
Note: Click image to view full size file.
Copy number change of MYL3:
| Dataset | Gene | EntrezID | Gain | Loss | Normal | Detail |
|---|---|---|---|---|---|---|
| GSE15526 | MYL3 | 4634 | 0 | 18 | 12 | |
| GSE20123 | MYL3 | 4634 | 0 | 19 | 11 | |
| GSE43470 | MYL3 | 4634 | 0 | 19 | 24 | |
| GSE46452 | MYL3 | 4634 | 2 | 17 | 40 | |
| GSE47630 | MYL3 | 4634 | 2 | 23 | 15 | |
| GSE54993 | MYL3 | 4634 | 7 | 2 | 61 | |
| GSE54994 | MYL3 | 4634 | 0 | 36 | 17 | |
| GSE60625 | MYL3 | 4634 | 5 | 0 | 6 | |
| GSE74703 | MYL3 | 4634 | 0 | 15 | 21 | |
| GSE74704 | MYL3 | 4634 | 0 | 12 | 8 | |
| TCGA | MYL3 | 4634 | 1 | 75 | 20 |
Total number of gains: 17; Total number of losses: 236; Total Number of normals: 235.
Somatic mutations of MYL3:
Generating mutation plots.
Highly correlated genes for MYL3:
Showing top 20/698 corelated genes with mean PCC>0.5.
| Gene1 | Gene2 | Mean PCC | Num. Datasets | Num. PCC<0 | Num. PCC>0.5 |
|---|---|---|---|---|---|
| MYL3 | MMP25 | 0.733263 | 3 | 0 | 3 |
| MYL3 | MAPRE3 | 0.712777 | 3 | 0 | 3 |
| MYL3 | KLHDC8A | 0.708598 | 3 | 0 | 3 |
| MYL3 | SH3GLB1 | 0.693933 | 3 | 0 | 3 |
| MYL3 | FRAS1 | 0.692657 | 4 | 0 | 4 |
| MYL3 | SIT1 | 0.691845 | 3 | 0 | 3 |
| MYL3 | ADRB1 | 0.691142 | 4 | 0 | 3 |
| MYL3 | DNAJB1 | 0.683881 | 3 | 0 | 3 |
| MYL3 | KAT2B | 0.681673 | 3 | 0 | 3 |
| MYL3 | EFR3B | 0.679316 | 3 | 0 | 3 |
| MYL3 | CDNF | 0.678872 | 3 | 0 | 3 |
| MYL3 | CAPN3 | 0.678444 | 4 | 0 | 4 |
| MYL3 | CCIN | 0.676034 | 5 | 0 | 5 |
| MYL3 | MASP1 | 0.673305 | 5 | 0 | 5 |
| MYL3 | GRPR | 0.673143 | 6 | 0 | 5 |
| MYL3 | CHGA | 0.670165 | 3 | 0 | 3 |
| MYL3 | CASQ1 | 0.668524 | 4 | 0 | 4 |
| MYL3 | IL5RA | 0.666096 | 4 | 0 | 4 |
| MYL3 | RNF148 | 0.665759 | 3 | 0 | 3 |
| MYL3 | PROS1 | 0.663339 | 3 | 0 | 3 |
For details and further investigation, click here