| Full name: SH3 and cysteine rich domain | Alias Symbol: STAC1 | ||
| Type: protein-coding gene | Cytoband: 3p22.3-p22.2 | ||
| Entrez ID: 6769 | HGNC ID: HGNC:11353 | Ensembl Gene: ENSG00000144681 | OMIM ID: 602317 |
Expression of STAC:
| Dataset | Gene | EntrezID | Probe | Log2FC | Adj.pValue | Expression |
|---|---|---|---|---|---|---|
| GSE17351 | STAC | 6769 | 205743_at | -0.2297 | 0.7140 | |
| GSE20347 | STAC | 6769 | 205743_at | 0.0168 | 0.8997 | |
| GSE23400 | STAC | 6769 | 205743_at | 0.0483 | 0.4046 | |
| GSE26886 | STAC | 6769 | 205743_at | -0.2433 | 0.2952 | |
| GSE29001 | STAC | 6769 | 205743_at | -0.3212 | 0.2072 | |
| GSE38129 | STAC | 6769 | 205743_at | -0.1490 | 0.3448 | |
| GSE45670 | STAC | 6769 | 205743_at | -0.2225 | 0.4775 | |
| GSE53622 | STAC | 6769 | 40768 | -0.4399 | 0.0931 | |
| GSE53624 | STAC | 6769 | 40768 | -0.4326 | 0.0733 | |
| GSE63941 | STAC | 6769 | 205743_at | 0.8713 | 0.1591 | |
| GSE77861 | STAC | 6769 | 205743_at | -0.0036 | 0.9823 | |
| GSE97050 | STAC | 6769 | A_24_P234415 | -0.3250 | 0.6072 | |
| SRP064894 | STAC | 6769 | RNAseq | -0.5883 | 0.0091 | |
| SRP133303 | STAC | 6769 | RNAseq | 0.4116 | 0.3166 | |
| SRP159526 | STAC | 6769 | RNAseq | 0.7071 | 0.2758 | |
| SRP219564 | STAC | 6769 | RNAseq | -0.4301 | 0.5347 | |
| TCGA | STAC | 6769 | RNAseq | 0.2984 | 0.3669 |
Upregulated datasets: 0; Downregulated datasets: 0.
Survival by STAC expression:
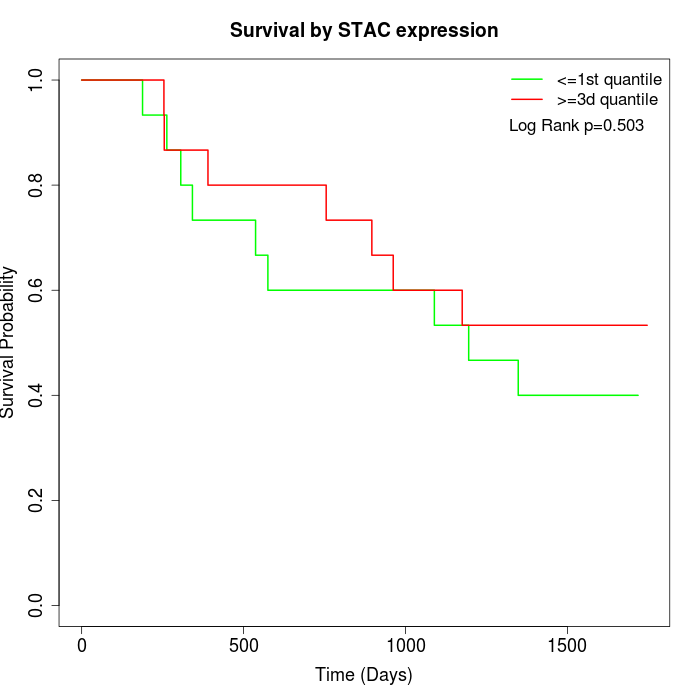 | 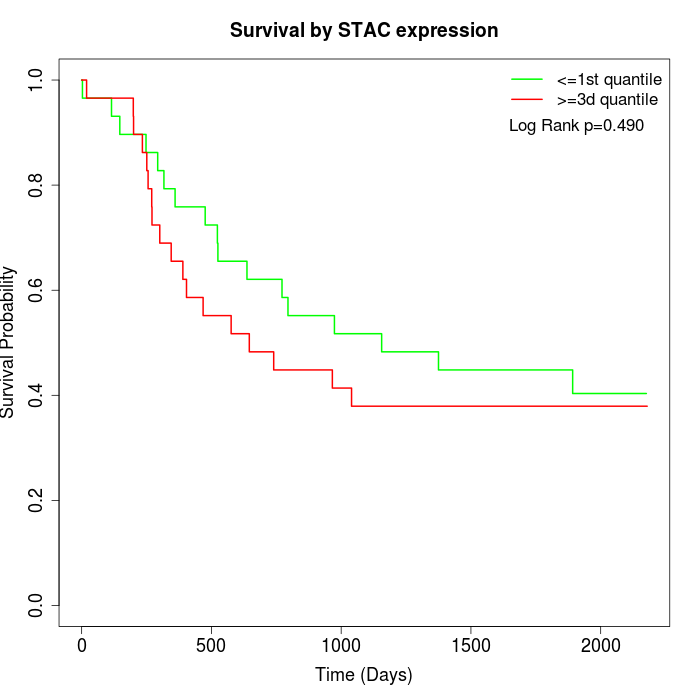 | 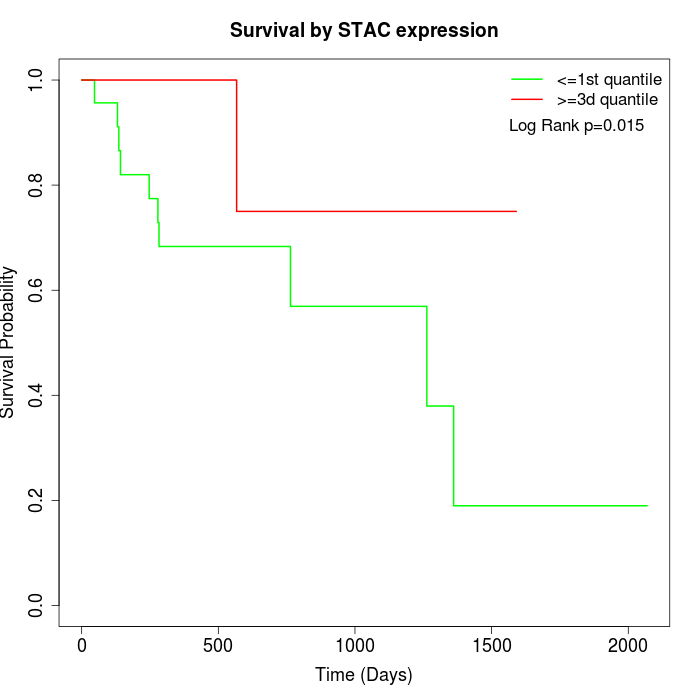 |
| GSE53622 | GSE53624 | TCGA |
Note: Click image to view full size file.
Copy number change of STAC:
| Dataset | Gene | EntrezID | Gain | Loss | Normal | Detail |
|---|---|---|---|---|---|---|
| GSE15526 | STAC | 6769 | 0 | 18 | 12 | |
| GSE20123 | STAC | 6769 | 0 | 18 | 12 | |
| GSE43470 | STAC | 6769 | 0 | 20 | 23 | |
| GSE46452 | STAC | 6769 | 2 | 17 | 40 | |
| GSE47630 | STAC | 6769 | 1 | 25 | 14 | |
| GSE54993 | STAC | 6769 | 6 | 3 | 61 | |
| GSE54994 | STAC | 6769 | 1 | 32 | 20 | |
| GSE60625 | STAC | 6769 | 5 | 0 | 6 | |
| GSE74703 | STAC | 6769 | 0 | 16 | 20 | |
| GSE74704 | STAC | 6769 | 0 | 12 | 8 | |
| TCGA | STAC | 6769 | 0 | 71 | 25 |
Total number of gains: 15; Total number of losses: 232; Total Number of normals: 241.
Somatic mutations of STAC:
Generating mutation plots.
Highly correlated genes for STAC:
Showing top 20/155 corelated genes with mean PCC>0.5.
| Gene1 | Gene2 | Mean PCC | Num. Datasets | Num. PCC<0 | Num. PCC>0.5 |
|---|---|---|---|---|---|
| STAC | KAT7 | 0.804356 | 3 | 0 | 3 |
| STAC | SEC31B | 0.770982 | 3 | 0 | 3 |
| STAC | ZNF771 | 0.767627 | 3 | 0 | 3 |
| STAC | KCND3 | 0.756048 | 3 | 0 | 3 |
| STAC | OCM2 | 0.73963 | 3 | 0 | 3 |
| STAC | ABCA6 | 0.739066 | 3 | 0 | 3 |
| STAC | CDC42EP1 | 0.738102 | 3 | 0 | 3 |
| STAC | GRIP2 | 0.737718 | 3 | 0 | 3 |
| STAC | KCNK2 | 0.736406 | 3 | 0 | 3 |
| STAC | CAV3 | 0.734904 | 4 | 0 | 4 |
| STAC | ZYX | 0.731307 | 3 | 0 | 3 |
| STAC | ZNF287 | 0.72855 | 3 | 0 | 3 |
| STAC | SIRT2 | 0.725431 | 3 | 0 | 3 |
| STAC | TMEM187 | 0.725306 | 3 | 0 | 3 |
| STAC | TSPYL2 | 0.722417 | 3 | 0 | 3 |
| STAC | POU6F1 | 0.721644 | 3 | 0 | 3 |
| STAC | PZP | 0.719761 | 3 | 0 | 3 |
| STAC | SH2D3C | 0.716392 | 3 | 0 | 3 |
| STAC | MYH7 | 0.715534 | 3 | 0 | 3 |
| STAC | HSPB7 | 0.7146 | 3 | 0 | 3 |
For details and further investigation, click here