| Full name: transcription elongation factor A2 | Alias Symbol: TFIIS | ||
| Type: protein-coding gene | Cytoband: 20q13.33 | ||
| Entrez ID: 6919 | HGNC ID: HGNC:11614 | Ensembl Gene: ENSG00000171703 | OMIM ID: 604784 |
Screen Evidence:
| |||
Expression of TCEA2:
| Dataset | Gene | EntrezID | Probe | Log2FC | Adj.pValue | Expression |
|---|---|---|---|---|---|---|
| GSE17351 | TCEA2 | 6919 | 203919_at | -0.2427 | 0.6960 | |
| GSE20347 | TCEA2 | 6919 | 203919_at | 0.1663 | 0.1710 | |
| GSE23400 | TCEA2 | 6919 | 203919_at | 0.1234 | 0.1625 | |
| GSE26886 | TCEA2 | 6919 | 241428_x_at | 0.7662 | 0.0000 | |
| GSE29001 | TCEA2 | 6919 | 203919_at | 0.2976 | 0.2535 | |
| GSE38129 | TCEA2 | 6919 | 203919_at | 0.0970 | 0.7844 | |
| GSE45670 | TCEA2 | 6919 | 203919_at | -0.5570 | 0.0120 | |
| GSE53622 | TCEA2 | 6919 | 105551 | -0.5125 | 0.0000 | |
| GSE53624 | TCEA2 | 6919 | 105551 | -0.2210 | 0.0018 | |
| GSE63941 | TCEA2 | 6919 | 203919_at | 0.7422 | 0.2760 | |
| GSE77861 | TCEA2 | 6919 | 241428_x_at | 0.0029 | 0.9844 | |
| GSE97050 | TCEA2 | 6919 | A_23_P147641 | -0.4083 | 0.2317 | |
| SRP007169 | TCEA2 | 6919 | RNAseq | -0.3297 | 0.6276 | |
| SRP064894 | TCEA2 | 6919 | RNAseq | 0.9606 | 0.0120 | |
| SRP133303 | TCEA2 | 6919 | RNAseq | -0.0272 | 0.9238 | |
| SRP159526 | TCEA2 | 6919 | RNAseq | 1.0251 | 0.0189 | |
| SRP193095 | TCEA2 | 6919 | RNAseq | 0.8722 | 0.0000 | |
| SRP219564 | TCEA2 | 6919 | RNAseq | -0.0252 | 0.9622 | |
| TCGA | TCEA2 | 6919 | RNAseq | -0.0374 | 0.7276 |
Upregulated datasets: 1; Downregulated datasets: 0.
Survival by TCEA2 expression:
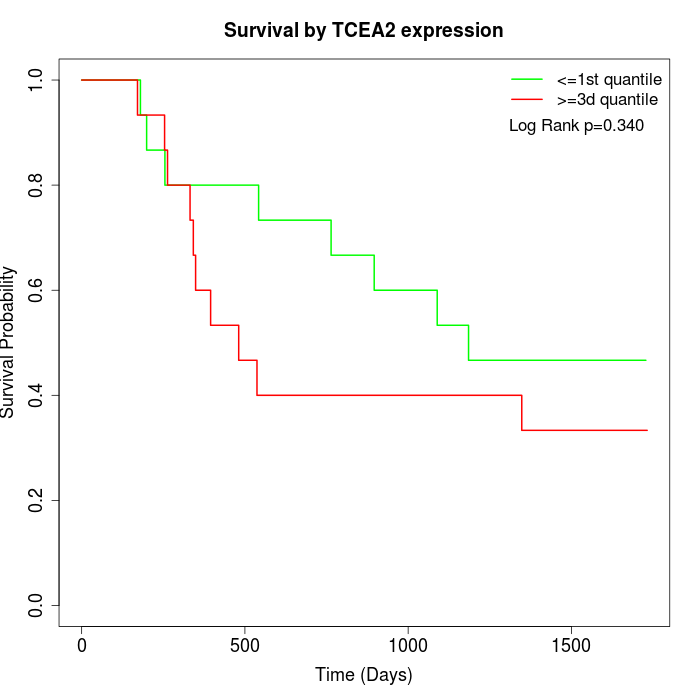 | 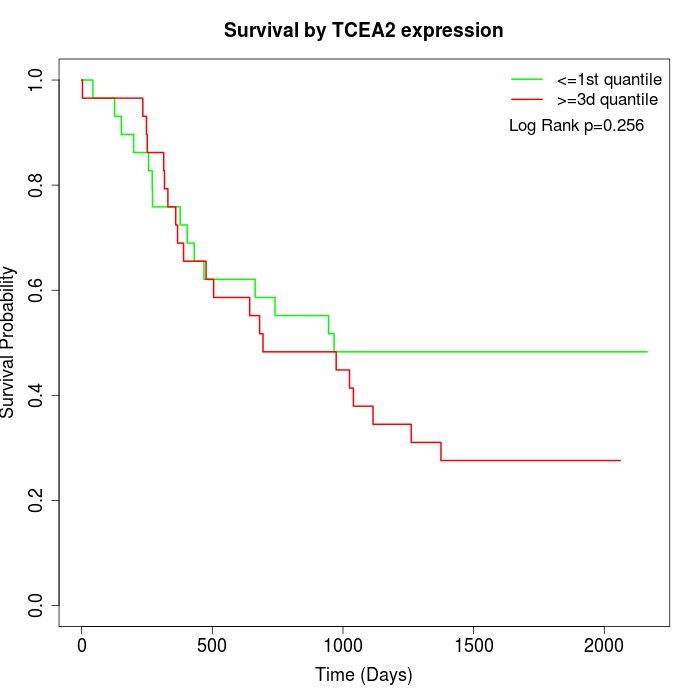 | 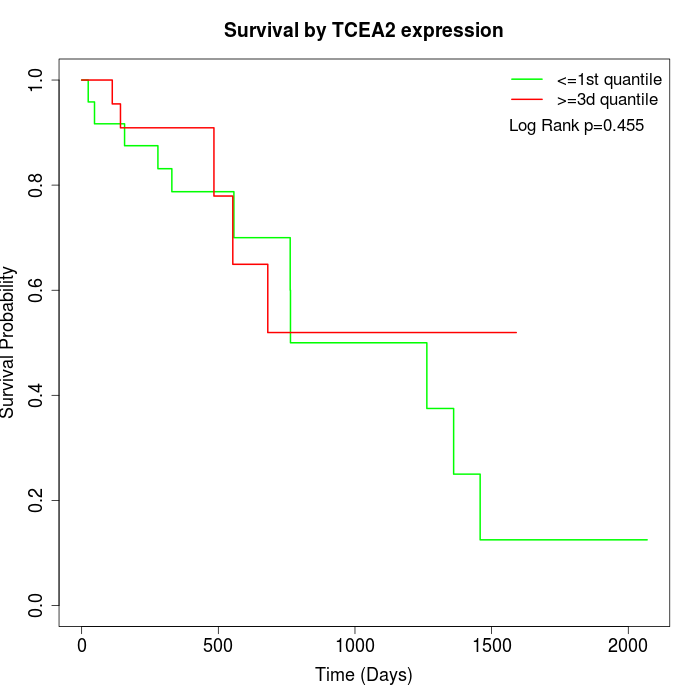 |
| GSE53622 | GSE53624 | TCGA |
Note: Click image to view full size file.
Copy number change of TCEA2:
| Dataset | Gene | EntrezID | Gain | Loss | Normal | Detail |
|---|---|---|---|---|---|---|
| GSE15526 | TCEA2 | 6919 | 13 | 2 | 15 | |
| GSE20123 | TCEA2 | 6919 | 13 | 2 | 15 | |
| GSE43470 | TCEA2 | 6919 | 11 | 1 | 31 | |
| GSE46452 | TCEA2 | 6919 | 35 | 0 | 24 | |
| GSE47630 | TCEA2 | 6919 | 25 | 1 | 14 | |
| GSE54993 | TCEA2 | 6919 | 0 | 17 | 53 | |
| GSE54994 | TCEA2 | 6919 | 29 | 0 | 24 | |
| GSE60625 | TCEA2 | 6919 | 0 | 0 | 11 | |
| GSE74703 | TCEA2 | 6919 | 10 | 0 | 26 | |
| GSE74704 | TCEA2 | 6919 | 10 | 0 | 10 | |
| TCGA | TCEA2 | 6919 | 44 | 4 | 48 |
Total number of gains: 190; Total number of losses: 27; Total Number of normals: 271.
Somatic mutations of TCEA2:
Generating mutation plots.
Highly correlated genes for TCEA2:
Showing top 20/863 corelated genes with mean PCC>0.5.
| Gene1 | Gene2 | Mean PCC | Num. Datasets | Num. PCC<0 | Num. PCC>0.5 |
|---|---|---|---|---|---|
| TCEA2 | COPZ2 | 0.778751 | 4 | 0 | 4 |
| TCEA2 | CHADL | 0.778531 | 3 | 0 | 3 |
| TCEA2 | UBXN10 | 0.771342 | 3 | 0 | 3 |
| TCEA2 | NENF | 0.765326 | 3 | 0 | 3 |
| TCEA2 | ATP2B4 | 0.744174 | 3 | 0 | 3 |
| TCEA2 | EFEMP1 | 0.740699 | 3 | 0 | 3 |
| TCEA2 | LNP1 | 0.739614 | 3 | 0 | 3 |
| TCEA2 | AKT3 | 0.736896 | 8 | 0 | 7 |
| TCEA2 | FIBIN | 0.734999 | 3 | 0 | 3 |
| TCEA2 | MYCT1 | 0.727991 | 3 | 0 | 3 |
| TCEA2 | FAM102B | 0.727306 | 3 | 0 | 3 |
| TCEA2 | MYEF2 | 0.726569 | 4 | 0 | 4 |
| TCEA2 | FAM171B | 0.719431 | 3 | 0 | 3 |
| TCEA2 | USP36 | 0.718219 | 3 | 0 | 3 |
| TCEA2 | SLC43A2 | 0.715735 | 3 | 0 | 3 |
| TCEA2 | ZFAND2A | 0.715249 | 3 | 0 | 3 |
| TCEA2 | TMED8 | 0.713464 | 3 | 0 | 3 |
| TCEA2 | DPY19L2 | 0.713419 | 3 | 0 | 3 |
| TCEA2 | PHF20 | 0.713102 | 3 | 0 | 3 |
| TCEA2 | TRRAP | 0.711419 | 3 | 0 | 3 |
For details and further investigation, click here