| Full name: EGF containing fibulin extracellular matrix protein 1 | Alias Symbol: S1-5|FBLN3|MTLV | ||
| Type: protein-coding gene | Cytoband: 2p16.1 | ||
| Entrez ID: 2202 | HGNC ID: HGNC:3218 | Ensembl Gene: ENSG00000115380 | OMIM ID: 601548 |
Expression of EFEMP1:
| Dataset | Gene | EntrezID | Probe | Log2FC | Adj.pValue | Expression |
|---|---|---|---|---|---|---|
| GSE17351 | EFEMP1 | 2202 | 201842_s_at | -1.0319 | 0.1937 | |
| GSE20347 | EFEMP1 | 2202 | 201842_s_at | -0.4218 | 0.2917 | |
| GSE23400 | EFEMP1 | 2202 | 201842_s_at | 0.0330 | 0.8949 | |
| GSE26886 | EFEMP1 | 2202 | 201842_s_at | 0.4942 | 0.4582 | |
| GSE29001 | EFEMP1 | 2202 | 201842_s_at | 0.5675 | 0.4211 | |
| GSE38129 | EFEMP1 | 2202 | 201842_s_at | -0.7452 | 0.1317 | |
| GSE45670 | EFEMP1 | 2202 | 201842_s_at | -1.6952 | 0.0035 | |
| GSE53622 | EFEMP1 | 2202 | 19805 | -0.4423 | 0.0110 | |
| GSE53624 | EFEMP1 | 2202 | 19805 | -0.1042 | 0.4756 | |
| GSE63941 | EFEMP1 | 2202 | 201842_s_at | -2.6874 | 0.0558 | |
| GSE77861 | EFEMP1 | 2202 | 201842_s_at | -0.6231 | 0.3579 | |
| GSE97050 | EFEMP1 | 2202 | A_23_P501007 | 0.7097 | 0.1189 | |
| SRP007169 | EFEMP1 | 2202 | RNAseq | 1.9836 | 0.0000 | |
| SRP008496 | EFEMP1 | 2202 | RNAseq | 2.4508 | 0.0000 | |
| SRP064894 | EFEMP1 | 2202 | RNAseq | 0.3839 | 0.3411 | |
| SRP133303 | EFEMP1 | 2202 | RNAseq | -0.1097 | 0.7823 | |
| SRP159526 | EFEMP1 | 2202 | RNAseq | 0.1566 | 0.7646 | |
| SRP193095 | EFEMP1 | 2202 | RNAseq | 0.7461 | 0.0064 | |
| SRP219564 | EFEMP1 | 2202 | RNAseq | 0.6430 | 0.4124 | |
| TCGA | EFEMP1 | 2202 | RNAseq | -0.2908 | 0.0341 |
Upregulated datasets: 2; Downregulated datasets: 1.
Survival by EFEMP1 expression:
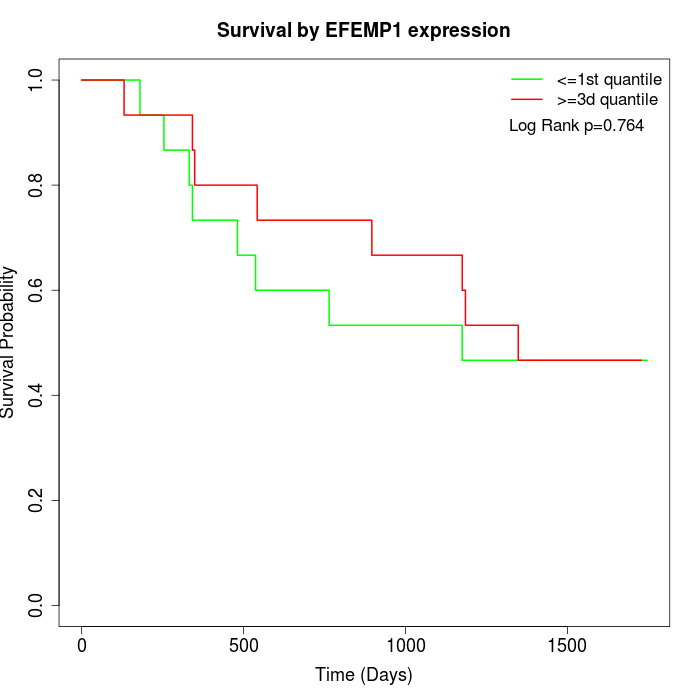 | 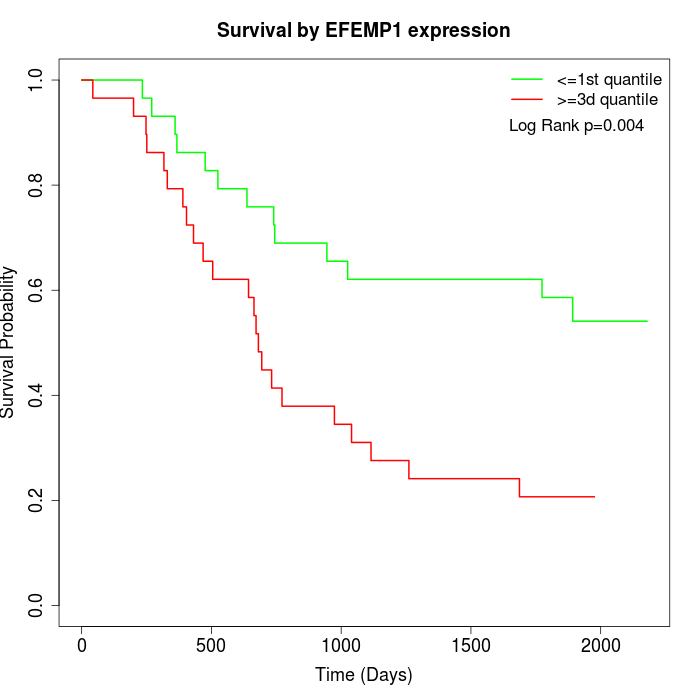 | 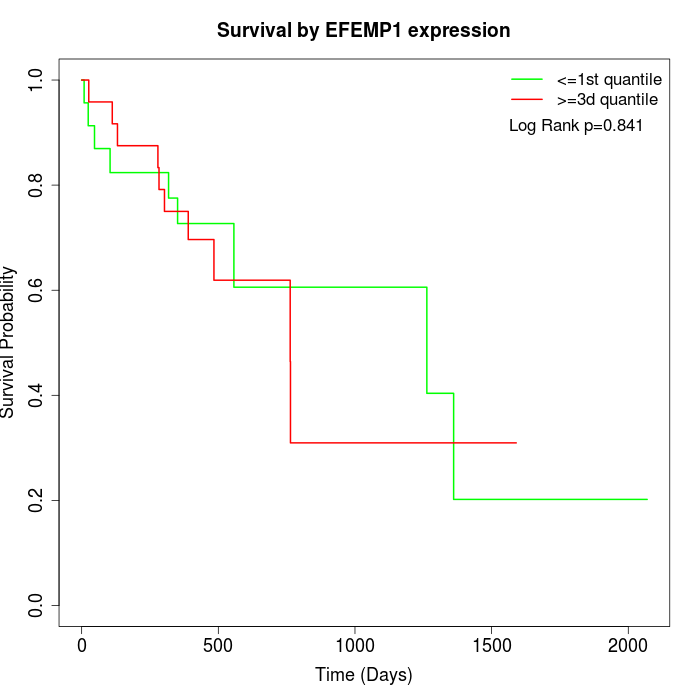 |
| GSE53622 | GSE53624 | TCGA |
Note: Click image to view full size file.
Copy number change of EFEMP1:
| Dataset | Gene | EntrezID | Gain | Loss | Normal | Detail |
|---|---|---|---|---|---|---|
| GSE15526 | EFEMP1 | 2202 | 10 | 0 | 20 | |
| GSE20123 | EFEMP1 | 2202 | 9 | 0 | 21 | |
| GSE43470 | EFEMP1 | 2202 | 5 | 0 | 38 | |
| GSE46452 | EFEMP1 | 2202 | 2 | 3 | 54 | |
| GSE47630 | EFEMP1 | 2202 | 8 | 0 | 32 | |
| GSE54993 | EFEMP1 | 2202 | 0 | 5 | 65 | |
| GSE54994 | EFEMP1 | 2202 | 12 | 0 | 41 | |
| GSE60625 | EFEMP1 | 2202 | 0 | 3 | 8 | |
| GSE74703 | EFEMP1 | 2202 | 5 | 0 | 31 | |
| GSE74704 | EFEMP1 | 2202 | 9 | 0 | 11 | |
| TCGA | EFEMP1 | 2202 | 34 | 3 | 59 |
Total number of gains: 94; Total number of losses: 14; Total Number of normals: 380.
Somatic mutations of EFEMP1:
Generating mutation plots.
Highly correlated genes for EFEMP1:
Showing top 20/694 corelated genes with mean PCC>0.5.
| Gene1 | Gene2 | Mean PCC | Num. Datasets | Num. PCC<0 | Num. PCC>0.5 |
|---|---|---|---|---|---|
| EFEMP1 | GPIHBP1 | 0.785834 | 3 | 0 | 3 |
| EFEMP1 | ZFAND3 | 0.74332 | 3 | 0 | 3 |
| EFEMP1 | TCEA2 | 0.740699 | 3 | 0 | 3 |
| EFEMP1 | RNASE4 | 0.725739 | 5 | 0 | 5 |
| EFEMP1 | TIE1 | 0.715317 | 5 | 0 | 5 |
| EFEMP1 | TGFBR2 | 0.713629 | 11 | 0 | 10 |
| EFEMP1 | CCDC80 | 0.711384 | 6 | 0 | 5 |
| EFEMP1 | FAM122C | 0.710425 | 3 | 0 | 3 |
| EFEMP1 | FLT1 | 0.705089 | 3 | 0 | 3 |
| EFEMP1 | FAM98B | 0.701053 | 3 | 0 | 3 |
| EFEMP1 | BAG3 | 0.698502 | 3 | 0 | 3 |
| EFEMP1 | SPTBN1 | 0.695975 | 6 | 0 | 5 |
| EFEMP1 | WHAMM | 0.69316 | 3 | 0 | 3 |
| EFEMP1 | OLFML3 | 0.687761 | 8 | 0 | 8 |
| EFEMP1 | RNF14 | 0.682823 | 4 | 0 | 3 |
| EFEMP1 | SNX25 | 0.677474 | 3 | 0 | 3 |
| EFEMP1 | LYVE1 | 0.676316 | 7 | 0 | 7 |
| EFEMP1 | DDR2 | 0.676306 | 8 | 0 | 7 |
| EFEMP1 | AMOTL1 | 0.675608 | 4 | 0 | 3 |
| EFEMP1 | CFH | 0.668337 | 8 | 0 | 7 |
For details and further investigation, click here