| Full name: transcription factor Dp-1 | Alias Symbol: Dp-1|DRTF1|DP1|DILC | ||
| Type: protein-coding gene | Cytoband: 13q34 | ||
| Entrez ID: 7027 | HGNC ID: HGNC:11749 | Ensembl Gene: ENSG00000198176 | OMIM ID: 189902 |
Screen Evidence:
| |||
TFDP1 involved pathways:
| KEGG pathway | Description | View |
|---|---|---|
| hsa04110 | Cell cycle | |
| hsa04350 | TGF-beta signaling pathway |
Expression of TFDP1:
| Dataset | Gene | EntrezID | Probe | Log2FC | Adj.pValue | Expression |
|---|---|---|---|---|---|---|
| GSE17351 | TFDP1 | 7027 | 212330_at | 0.3143 | 0.2753 | |
| GSE20347 | TFDP1 | 7027 | 212330_at | 0.3413 | 0.3863 | |
| GSE23400 | TFDP1 | 7027 | 212330_at | 0.6474 | 0.0000 | |
| GSE26886 | TFDP1 | 7027 | 212330_at | -0.8160 | 0.0010 | |
| GSE29001 | TFDP1 | 7027 | 212330_at | 0.7303 | 0.0101 | |
| GSE38129 | TFDP1 | 7027 | 212330_at | 0.5682 | 0.0188 | |
| GSE45670 | TFDP1 | 7027 | 212330_at | 0.3944 | 0.0209 | |
| GSE53622 | TFDP1 | 7027 | 11378 | 0.3411 | 0.0000 | |
| GSE53624 | TFDP1 | 7027 | 33038 | 0.1747 | 0.0239 | |
| GSE63941 | TFDP1 | 7027 | 212330_at | 0.2935 | 0.5459 | |
| GSE77861 | TFDP1 | 7027 | 212330_at | 0.0066 | 0.9823 | |
| GSE97050 | TFDP1 | 7027 | A_32_P199301 | 0.5908 | 0.1857 | |
| SRP007169 | TFDP1 | 7027 | RNAseq | 1.0958 | 0.0283 | |
| SRP008496 | TFDP1 | 7027 | RNAseq | 1.1420 | 0.0048 | |
| SRP064894 | TFDP1 | 7027 | RNAseq | 0.4951 | 0.0388 | |
| SRP133303 | TFDP1 | 7027 | RNAseq | 0.2528 | 0.1640 | |
| SRP159526 | TFDP1 | 7027 | RNAseq | 0.0303 | 0.9249 | |
| SRP193095 | TFDP1 | 7027 | RNAseq | 0.1946 | 0.1509 | |
| SRP219564 | TFDP1 | 7027 | RNAseq | 0.5324 | 0.1912 | |
| TCGA | TFDP1 | 7027 | RNAseq | 0.2832 | 0.0000 |
Upregulated datasets: 2; Downregulated datasets: 0.
Survival by TFDP1 expression:
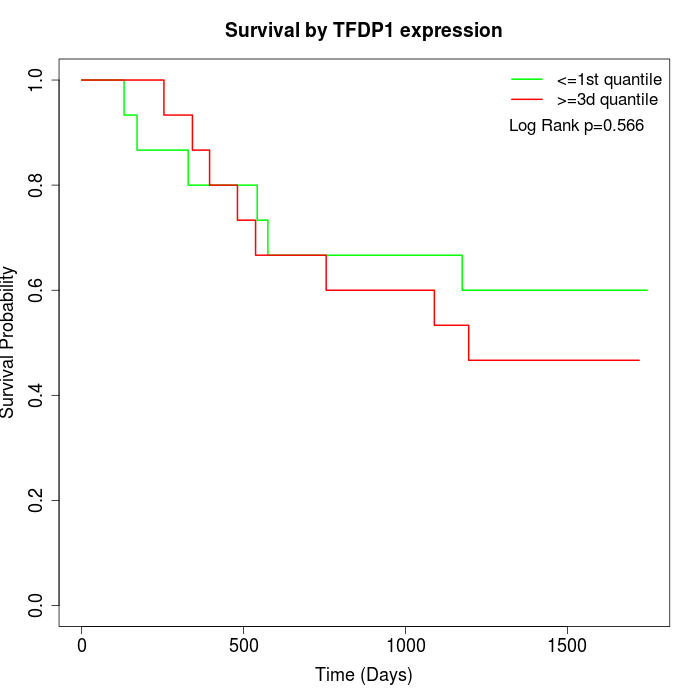 | 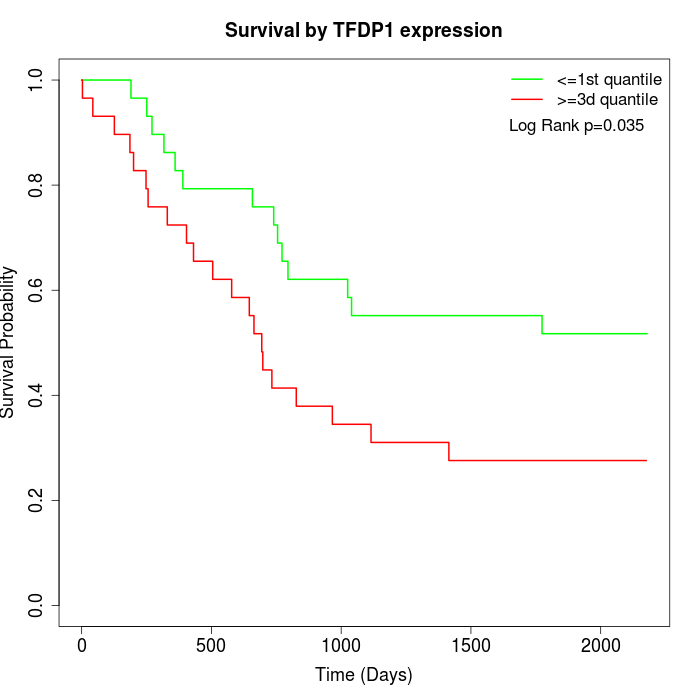 | 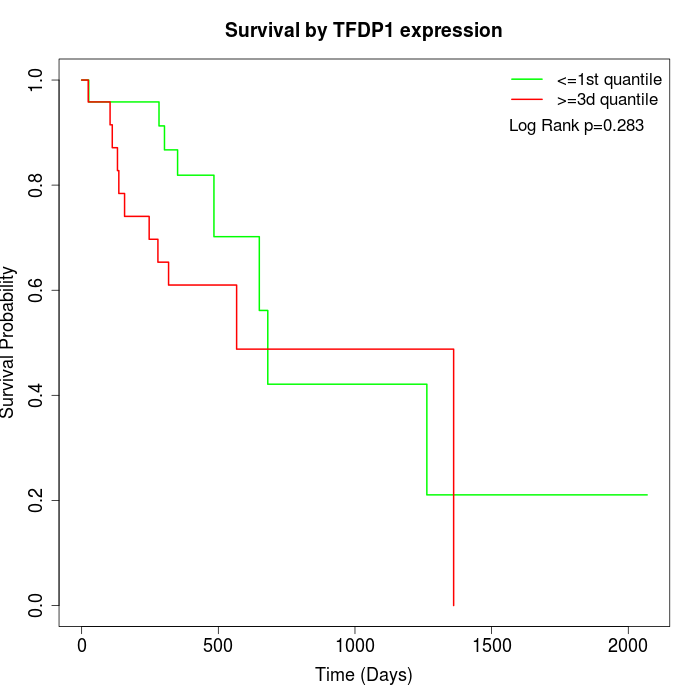 |
| GSE53622 | GSE53624 | TCGA |
Note: Click image to view full size file.
Copy number change of TFDP1:
| Dataset | Gene | EntrezID | Gain | Loss | Normal | Detail |
|---|---|---|---|---|---|---|
| GSE15526 | TFDP1 | 7027 | 6 | 12 | 12 | |
| GSE20123 | TFDP1 | 7027 | 6 | 11 | 13 | |
| GSE43470 | TFDP1 | 7027 | 4 | 13 | 26 | |
| GSE46452 | TFDP1 | 7027 | 3 | 31 | 25 | |
| GSE47630 | TFDP1 | 7027 | 3 | 26 | 11 | |
| GSE54993 | TFDP1 | 7027 | 12 | 3 | 55 | |
| GSE54994 | TFDP1 | 7027 | 9 | 10 | 34 | |
| GSE60625 | TFDP1 | 7027 | 0 | 3 | 8 | |
| GSE74703 | TFDP1 | 7027 | 3 | 10 | 23 | |
| GSE74704 | TFDP1 | 7027 | 4 | 9 | 7 | |
| TCGA | TFDP1 | 7027 | 19 | 31 | 46 |
Total number of gains: 69; Total number of losses: 159; Total Number of normals: 260.
Somatic mutations of TFDP1:
Generating mutation plots.
Highly correlated genes for TFDP1:
Showing top 20/583 corelated genes with mean PCC>0.5.
| Gene1 | Gene2 | Mean PCC | Num. Datasets | Num. PCC<0 | Num. PCC>0.5 |
|---|---|---|---|---|---|
| TFDP1 | TBC1D14 | 0.734894 | 3 | 0 | 3 |
| TFDP1 | KRI1 | 0.733988 | 3 | 0 | 3 |
| TFDP1 | DPY19L3 | 0.727233 | 3 | 0 | 3 |
| TFDP1 | XPNPEP1 | 0.7162 | 3 | 0 | 3 |
| TFDP1 | CLPTM1L | 0.715034 | 3 | 0 | 3 |
| TFDP1 | C8orf76 | 0.709121 | 3 | 0 | 3 |
| TFDP1 | PDCD2L | 0.698735 | 4 | 0 | 3 |
| TFDP1 | SARS2 | 0.6985 | 3 | 0 | 3 |
| TFDP1 | SYK | 0.697893 | 3 | 0 | 3 |
| TFDP1 | FUCA2 | 0.691459 | 3 | 0 | 3 |
| TFDP1 | SUV39H1 | 0.690709 | 4 | 0 | 4 |
| TFDP1 | TMPO | 0.690426 | 6 | 0 | 6 |
| TFDP1 | ARHGEF19 | 0.688137 | 4 | 0 | 3 |
| TFDP1 | RAB3IP | 0.682258 | 3 | 0 | 3 |
| TFDP1 | SLC1A5 | 0.681884 | 4 | 0 | 3 |
| TFDP1 | TSTA3 | 0.681081 | 4 | 0 | 3 |
| TFDP1 | STAG1 | 0.680409 | 3 | 0 | 3 |
| TFDP1 | MLKL | 0.676544 | 3 | 0 | 3 |
| TFDP1 | ZNF670 | 0.670424 | 4 | 0 | 4 |
| TFDP1 | TMEM218 | 0.665015 | 3 | 0 | 3 |
For details and further investigation, click here