| Full name: TBC1 domain family member 14 | Alias Symbol: KIAA1322 | ||
| Type: protein-coding gene | Cytoband: 4p16.1 | ||
| Entrez ID: 57533 | HGNC ID: HGNC:29246 | Ensembl Gene: ENSG00000132405 | OMIM ID: 614855 |
Expression of TBC1D14:
| Dataset | Gene | EntrezID | Probe | Log2FC | Adj.pValue | Expression |
|---|---|---|---|---|---|---|
| GSE17351 | TBC1D14 | 57533 | 224622_at | 0.5299 | 0.2028 | |
| GSE26886 | TBC1D14 | 57533 | 224622_at | -0.9242 | 0.0016 | |
| GSE45670 | TBC1D14 | 57533 | 224622_at | -0.0235 | 0.8773 | |
| GSE63941 | TBC1D14 | 57533 | 224622_at | -0.0839 | 0.8129 | |
| GSE77861 | TBC1D14 | 57533 | 224622_at | -0.0167 | 0.9625 | |
| GSE97050 | TBC1D14 | 57533 | A_23_P155830 | -0.0553 | 0.8484 | |
| SRP007169 | TBC1D14 | 57533 | RNAseq | -1.3389 | 0.0169 | |
| SRP008496 | TBC1D14 | 57533 | RNAseq | -0.9448 | 0.0044 | |
| SRP064894 | TBC1D14 | 57533 | RNAseq | -0.3739 | 0.0280 | |
| SRP133303 | TBC1D14 | 57533 | RNAseq | -0.4134 | 0.0048 | |
| SRP159526 | TBC1D14 | 57533 | RNAseq | -0.2700 | 0.1175 | |
| SRP193095 | TBC1D14 | 57533 | RNAseq | -0.2853 | 0.0112 | |
| SRP219564 | TBC1D14 | 57533 | RNAseq | -0.2577 | 0.4496 | |
| TCGA | TBC1D14 | 57533 | RNAseq | -0.3534 | 0.0000 |
Upregulated datasets: 0; Downregulated datasets: 1.
Survival by TBC1D14 expression:
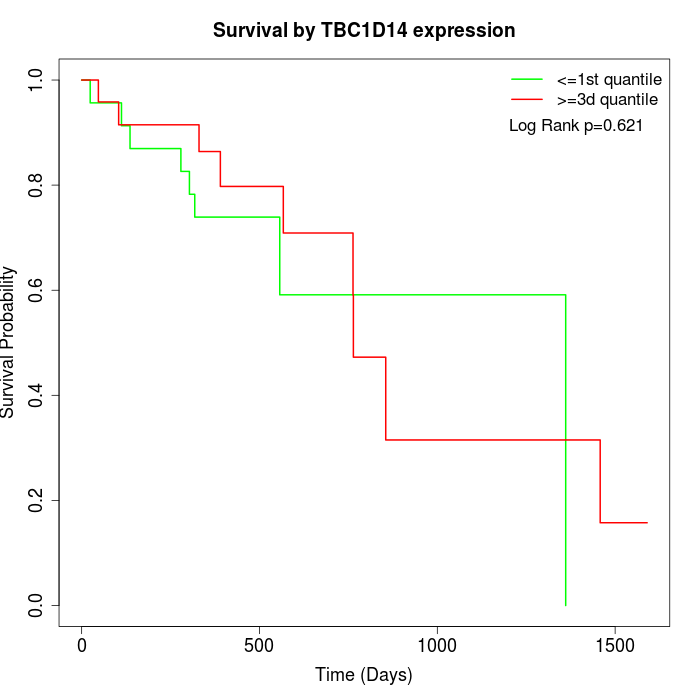 |
| TCGA |
Note: Click image to view full size file.
Copy number change of TBC1D14:
| Dataset | Gene | EntrezID | Gain | Loss | Normal | Detail |
|---|---|---|---|---|---|---|
| GSE15526 | TBC1D14 | 57533 | 0 | 18 | 12 | |
| GSE20123 | TBC1D14 | 57533 | 0 | 18 | 12 | |
| GSE43470 | TBC1D14 | 57533 | 0 | 17 | 26 | |
| GSE46452 | TBC1D14 | 57533 | 1 | 36 | 22 | |
| GSE47630 | TBC1D14 | 57533 | 1 | 19 | 20 | |
| GSE54993 | TBC1D14 | 57533 | 10 | 0 | 60 | |
| GSE54994 | TBC1D14 | 57533 | 3 | 12 | 38 | |
| GSE60625 | TBC1D14 | 57533 | 0 | 0 | 11 | |
| GSE74703 | TBC1D14 | 57533 | 0 | 13 | 23 | |
| GSE74704 | TBC1D14 | 57533 | 0 | 10 | 10 | |
| TCGA | TBC1D14 | 57533 | 7 | 48 | 41 |
Total number of gains: 22; Total number of losses: 191; Total Number of normals: 275.
Somatic mutations of TBC1D14:
Generating mutation plots.
Highly correlated genes for TBC1D14:
Showing top 20/101 corelated genes with mean PCC>0.5.
| Gene1 | Gene2 | Mean PCC | Num. Datasets | Num. PCC<0 | Num. PCC>0.5 |
|---|---|---|---|---|---|
| TBC1D14 | TFDP1 | 0.734894 | 3 | 0 | 3 |
| TBC1D14 | WSB2 | 0.7234 | 3 | 0 | 3 |
| TBC1D14 | MTHFR | 0.691207 | 5 | 0 | 5 |
| TBC1D14 | PPARGC1B | 0.680349 | 3 | 0 | 3 |
| TBC1D14 | KCTD15 | 0.666934 | 3 | 0 | 3 |
| TBC1D14 | HGSNAT | 0.664975 | 3 | 0 | 3 |
| TBC1D14 | PPP1R3D | 0.658033 | 3 | 0 | 3 |
| TBC1D14 | CHAMP1 | 0.655085 | 3 | 0 | 3 |
| TBC1D14 | DPAGT1 | 0.654702 | 3 | 0 | 3 |
| TBC1D14 | SLC39A1 | 0.653568 | 3 | 0 | 3 |
| TBC1D14 | PGAP2 | 0.650648 | 3 | 0 | 3 |
| TBC1D14 | USP21 | 0.642184 | 3 | 0 | 3 |
| TBC1D14 | WDR37 | 0.638891 | 4 | 0 | 4 |
| TBC1D14 | TRAM1 | 0.636603 | 3 | 0 | 3 |
| TBC1D14 | SLC39A9 | 0.635564 | 3 | 0 | 3 |
| TBC1D14 | TMEM115 | 0.634967 | 3 | 0 | 3 |
| TBC1D14 | RNASEH2B | 0.633862 | 3 | 0 | 3 |
| TBC1D14 | ALDH2 | 0.632691 | 3 | 0 | 3 |
| TBC1D14 | PCNT | 0.628933 | 4 | 0 | 3 |
| TBC1D14 | RAB3D | 0.627375 | 3 | 0 | 3 |
For details and further investigation, click here