| Full name: transmembrane protein 30A | Alias Symbol: FLJ10856|CDC50A | ||
| Type: protein-coding gene | Cytoband: 6q14.1 | ||
| Entrez ID: 55754 | HGNC ID: HGNC:16667 | Ensembl Gene: ENSG00000112697 | OMIM ID: 611028 |
Screen Evidence:
| |||
Expression of TMEM30A:
| Dataset | Gene | EntrezID | Probe | Log2FC | Adj.pValue | Expression |
|---|---|---|---|---|---|---|
| GSE17351 | TMEM30A | 55754 | 222391_at | -0.1653 | 0.6393 | |
| GSE20347 | TMEM30A | 55754 | 217743_s_at | -0.0537 | 0.7523 | |
| GSE23400 | TMEM30A | 55754 | 217743_s_at | 0.2190 | 0.0096 | |
| GSE26886 | TMEM30A | 55754 | 217743_s_at | -0.6180 | 0.0142 | |
| GSE29001 | TMEM30A | 55754 | 217743_s_at | -0.1098 | 0.7697 | |
| GSE38129 | TMEM30A | 55754 | 217743_s_at | 0.2512 | 0.0590 | |
| GSE45670 | TMEM30A | 55754 | 222391_at | -0.2312 | 0.1293 | |
| GSE53622 | TMEM30A | 55754 | 36536 | -0.3692 | 0.0000 | |
| GSE53624 | TMEM30A | 55754 | 36536 | -0.2785 | 0.0000 | |
| GSE63941 | TMEM30A | 55754 | 232591_s_at | 0.1629 | 0.7356 | |
| GSE77861 | TMEM30A | 55754 | 222391_at | -0.0088 | 0.9879 | |
| GSE97050 | TMEM30A | 55754 | A_33_P3380982 | -0.5521 | 0.1076 | |
| SRP007169 | TMEM30A | 55754 | RNAseq | -0.4465 | 0.1740 | |
| SRP008496 | TMEM30A | 55754 | RNAseq | -0.2125 | 0.3681 | |
| SRP064894 | TMEM30A | 55754 | RNAseq | -0.0275 | 0.9030 | |
| SRP133303 | TMEM30A | 55754 | RNAseq | 0.3113 | 0.0319 | |
| SRP159526 | TMEM30A | 55754 | RNAseq | -0.0597 | 0.7976 | |
| SRP193095 | TMEM30A | 55754 | RNAseq | -0.3560 | 0.0159 | |
| SRP219564 | TMEM30A | 55754 | RNAseq | -0.3024 | 0.3939 | |
| TCGA | TMEM30A | 55754 | RNAseq | -0.0588 | 0.1439 |
Upregulated datasets: 0; Downregulated datasets: 0.
Survival by TMEM30A expression:
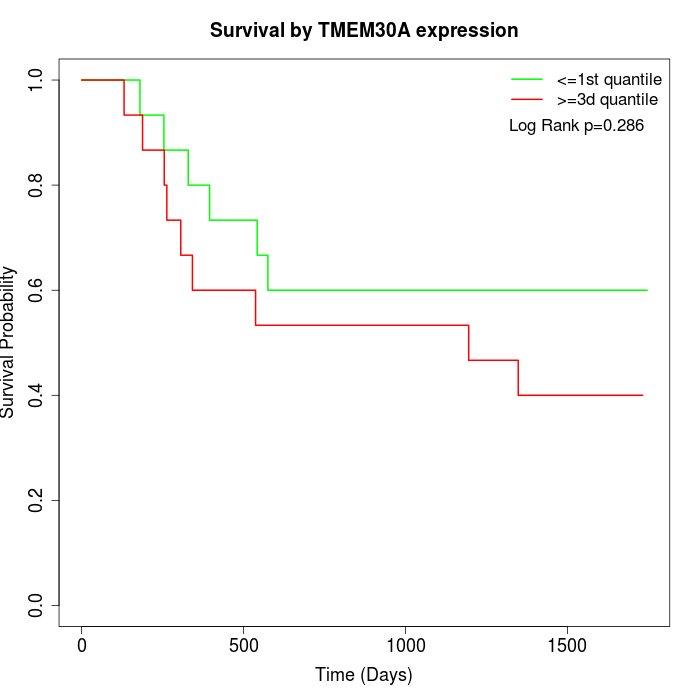 | 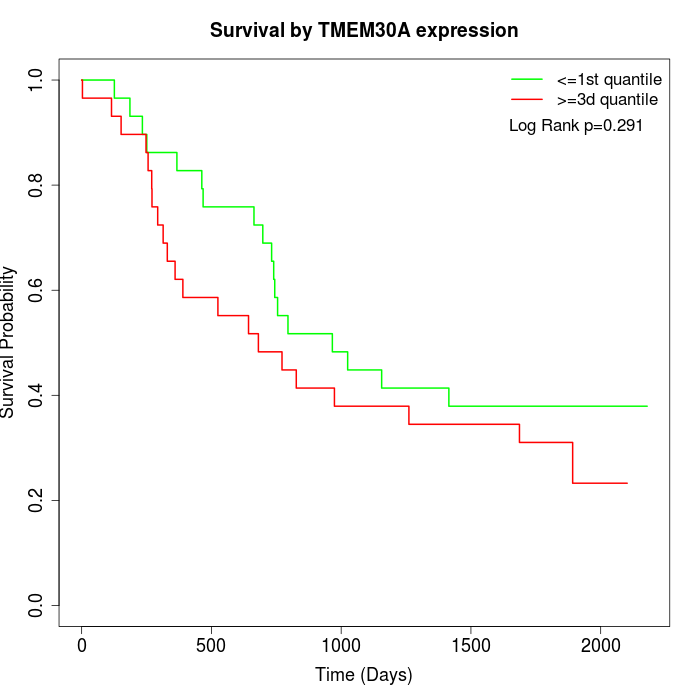 | 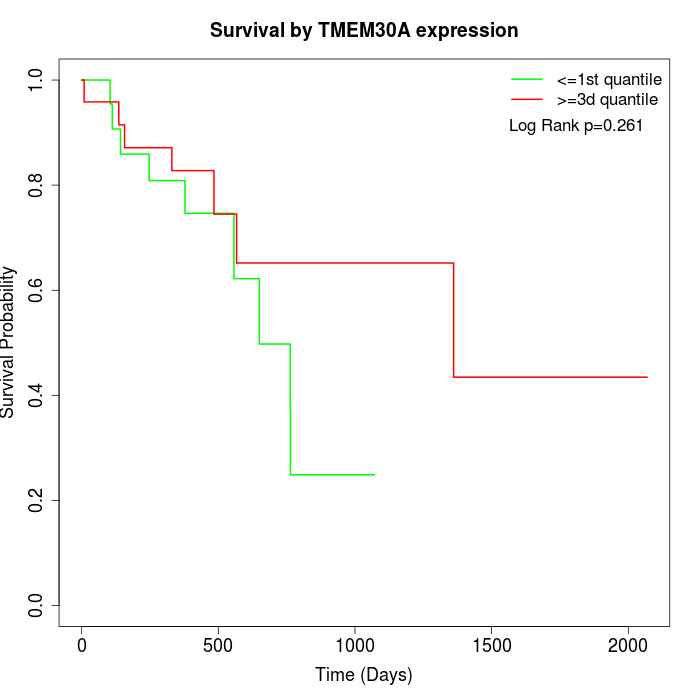 |
| GSE53622 | GSE53624 | TCGA |
Note: Click image to view full size file.
Copy number change of TMEM30A:
| Dataset | Gene | EntrezID | Gain | Loss | Normal | Detail |
|---|---|---|---|---|---|---|
| GSE15526 | TMEM30A | 55754 | 1 | 3 | 26 | |
| GSE20123 | TMEM30A | 55754 | 1 | 2 | 27 | |
| GSE43470 | TMEM30A | 55754 | 3 | 0 | 40 | |
| GSE46452 | TMEM30A | 55754 | 2 | 11 | 46 | |
| GSE47630 | TMEM30A | 55754 | 8 | 4 | 28 | |
| GSE54993 | TMEM30A | 55754 | 3 | 2 | 65 | |
| GSE54994 | TMEM30A | 55754 | 8 | 6 | 39 | |
| GSE60625 | TMEM30A | 55754 | 0 | 1 | 10 | |
| GSE74703 | TMEM30A | 55754 | 3 | 0 | 33 | |
| GSE74704 | TMEM30A | 55754 | 0 | 1 | 19 | |
| TCGA | TMEM30A | 55754 | 9 | 20 | 67 |
Total number of gains: 38; Total number of losses: 50; Total Number of normals: 400.
Somatic mutations of TMEM30A:
Generating mutation plots.
Highly correlated genes for TMEM30A:
Showing top 20/482 corelated genes with mean PCC>0.5.
| Gene1 | Gene2 | Mean PCC | Num. Datasets | Num. PCC<0 | Num. PCC>0.5 |
|---|---|---|---|---|---|
| TMEM30A | CCNDBP1 | 0.782004 | 3 | 0 | 3 |
| TMEM30A | TCTEX1D2 | 0.779588 | 3 | 0 | 3 |
| TMEM30A | FGFR1OP2 | 0.768481 | 3 | 0 | 3 |
| TMEM30A | NHS | 0.761935 | 4 | 0 | 4 |
| TMEM30A | CYP4V2 | 0.760658 | 3 | 0 | 3 |
| TMEM30A | ZNF347 | 0.759314 | 3 | 0 | 3 |
| TMEM30A | LCA5 | 0.751445 | 3 | 0 | 3 |
| TMEM30A | TM9SF3 | 0.750346 | 4 | 0 | 3 |
| TMEM30A | CTTNBP2NL | 0.745143 | 3 | 0 | 3 |
| TMEM30A | CTPS2 | 0.742763 | 4 | 0 | 3 |
| TMEM30A | ZNF547 | 0.741268 | 3 | 0 | 3 |
| TMEM30A | FAM98B | 0.740555 | 4 | 0 | 4 |
| TMEM30A | SKAP2 | 0.737087 | 4 | 0 | 3 |
| TMEM30A | VPS29 | 0.729776 | 3 | 0 | 3 |
| TMEM30A | KLHDC9 | 0.721326 | 4 | 0 | 4 |
| TMEM30A | XPO4 | 0.720516 | 3 | 0 | 3 |
| TMEM30A | RAB2A | 0.719842 | 3 | 0 | 3 |
| TMEM30A | ACBD3 | 0.71785 | 3 | 0 | 3 |
| TMEM30A | ABHD14B | 0.709163 | 3 | 0 | 3 |
| TMEM30A | COPS2 | 0.7083 | 4 | 0 | 4 |
For details and further investigation, click here