| Full name: transmembrane 9 superfamily member 3 | Alias Symbol: SMBP | ||
| Type: protein-coding gene | Cytoband: 10q24.1 | ||
| Entrez ID: 56889 | HGNC ID: HGNC:21529 | Ensembl Gene: ENSG00000077147 | OMIM ID: 616872 |
Screen Evidence:
| |||
Expression of TM9SF3:
| Dataset | Gene | EntrezID | Probe | Log2FC | Adj.pValue | Expression |
|---|---|---|---|---|---|---|
| GSE17351 | TM9SF3 | 56889 | 222399_s_at | -0.0033 | 0.9954 | |
| GSE20347 | TM9SF3 | 56889 | 217758_s_at | -0.4902 | 0.0000 | |
| GSE23400 | TM9SF3 | 56889 | 217758_s_at | -0.1292 | 0.0608 | |
| GSE26886 | TM9SF3 | 56889 | 217758_s_at | -0.4334 | 0.0567 | |
| GSE29001 | TM9SF3 | 56889 | 217758_s_at | -0.2504 | 0.1390 | |
| GSE38129 | TM9SF3 | 56889 | 217758_s_at | -0.2443 | 0.0419 | |
| GSE45670 | TM9SF3 | 56889 | 222399_s_at | -0.0315 | 0.7687 | |
| GSE53622 | TM9SF3 | 56889 | 16536 | -0.3990 | 0.0000 | |
| GSE53624 | TM9SF3 | 56889 | 16536 | -0.3401 | 0.0000 | |
| GSE63941 | TM9SF3 | 56889 | 222399_s_at | -0.0932 | 0.7536 | |
| GSE77861 | TM9SF3 | 56889 | 222399_s_at | -0.4033 | 0.2441 | |
| GSE97050 | TM9SF3 | 56889 | A_24_P309360 | 0.0178 | 0.9440 | |
| SRP007169 | TM9SF3 | 56889 | RNAseq | -0.6359 | 0.0894 | |
| SRP008496 | TM9SF3 | 56889 | RNAseq | -0.1575 | 0.4807 | |
| SRP064894 | TM9SF3 | 56889 | RNAseq | -0.4094 | 0.0031 | |
| SRP133303 | TM9SF3 | 56889 | RNAseq | -0.0885 | 0.5507 | |
| SRP159526 | TM9SF3 | 56889 | RNAseq | -0.1819 | 0.5705 | |
| SRP193095 | TM9SF3 | 56889 | RNAseq | -0.7146 | 0.0002 | |
| SRP219564 | TM9SF3 | 56889 | RNAseq | -0.3538 | 0.0211 | |
| TCGA | TM9SF3 | 56889 | RNAseq | -0.2590 | 0.0000 |
Upregulated datasets: 0; Downregulated datasets: 0.
Survival by TM9SF3 expression:
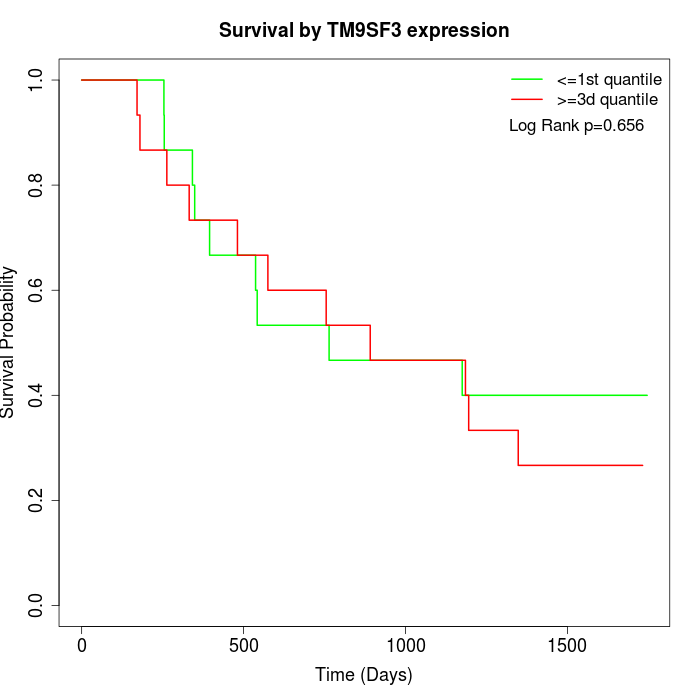 | 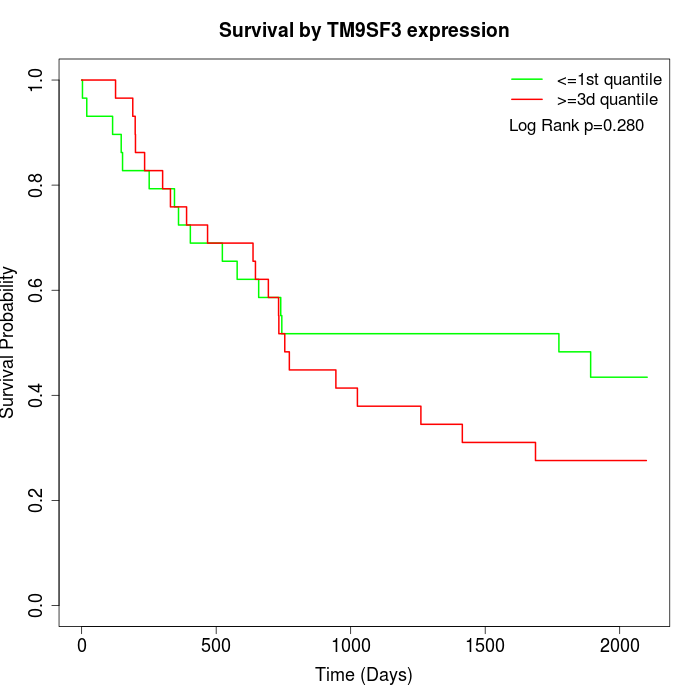 | 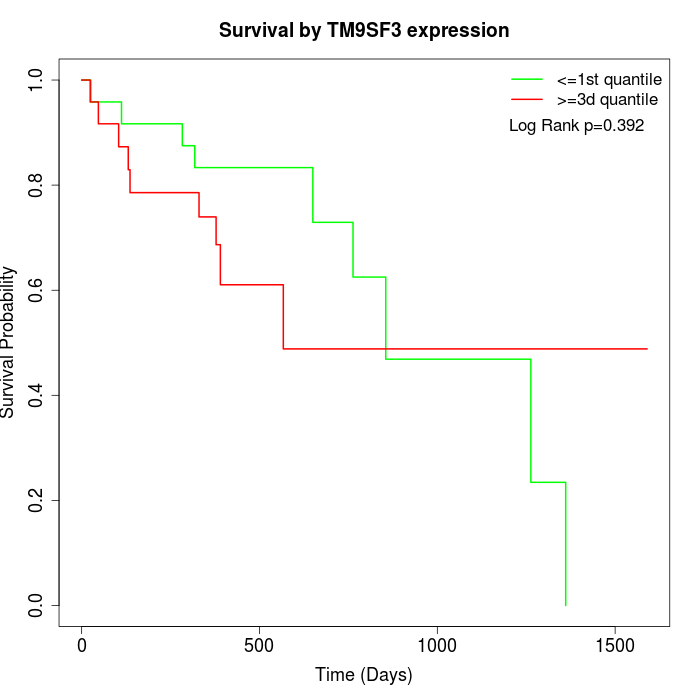 |
| GSE53622 | GSE53624 | TCGA |
Note: Click image to view full size file.
Copy number change of TM9SF3:
| Dataset | Gene | EntrezID | Gain | Loss | Normal | Detail |
|---|---|---|---|---|---|---|
| GSE15526 | TM9SF3 | 56889 | 0 | 8 | 22 | |
| GSE20123 | TM9SF3 | 56889 | 0 | 7 | 23 | |
| GSE43470 | TM9SF3 | 56889 | 0 | 7 | 36 | |
| GSE46452 | TM9SF3 | 56889 | 0 | 11 | 48 | |
| GSE47630 | TM9SF3 | 56889 | 2 | 14 | 24 | |
| GSE54993 | TM9SF3 | 56889 | 7 | 0 | 63 | |
| GSE54994 | TM9SF3 | 56889 | 2 | 10 | 41 | |
| GSE60625 | TM9SF3 | 56889 | 0 | 0 | 11 | |
| GSE74703 | TM9SF3 | 56889 | 0 | 5 | 31 | |
| GSE74704 | TM9SF3 | 56889 | 0 | 4 | 16 | |
| TCGA | TM9SF3 | 56889 | 5 | 28 | 63 |
Total number of gains: 16; Total number of losses: 94; Total Number of normals: 378.
Somatic mutations of TM9SF3:
Generating mutation plots.
Highly correlated genes for TM9SF3:
Showing top 20/748 corelated genes with mean PCC>0.5.
| Gene1 | Gene2 | Mean PCC | Num. Datasets | Num. PCC<0 | Num. PCC>0.5 |
|---|---|---|---|---|---|
| TM9SF3 | HNRNPH3 | 0.826992 | 3 | 0 | 3 |
| TM9SF3 | SAR1A | 0.823413 | 3 | 0 | 3 |
| TM9SF3 | ZNF616 | 0.812684 | 3 | 0 | 3 |
| TM9SF3 | LARP4 | 0.786091 | 3 | 0 | 3 |
| TM9SF3 | SDHB | 0.766446 | 4 | 0 | 3 |
| TM9SF3 | TMEM30A | 0.750346 | 4 | 0 | 3 |
| TM9SF3 | ARL16 | 0.748659 | 3 | 0 | 3 |
| TM9SF3 | ZNF41 | 0.741155 | 3 | 0 | 3 |
| TM9SF3 | ZRANB2 | 0.740909 | 3 | 0 | 3 |
| TM9SF3 | COPS2 | 0.738705 | 3 | 0 | 3 |
| TM9SF3 | ZDHHC5 | 0.732813 | 3 | 0 | 3 |
| TM9SF3 | TET2 | 0.725017 | 4 | 0 | 4 |
| TM9SF3 | PRDX4 | 0.715859 | 4 | 0 | 3 |
| TM9SF3 | ATP6V0B | 0.71189 | 3 | 0 | 3 |
| TM9SF3 | PHF6 | 0.708122 | 3 | 0 | 3 |
| TM9SF3 | NSMCE4A | 0.70771 | 4 | 0 | 4 |
| TM9SF3 | UBE2N | 0.707531 | 4 | 0 | 4 |
| TM9SF3 | ZNF644 | 0.705051 | 4 | 0 | 4 |
| TM9SF3 | EIF2B1 | 0.702569 | 3 | 0 | 3 |
| TM9SF3 | SNX18 | 0.700141 | 3 | 0 | 3 |
For details and further investigation, click here