| Full name: tumor protein p53 inducible nuclear protein 2 | Alias Symbol: FLJ21759|FLJ23500|DKFZp434B2411|DKFZp434O0827|dJ1181N3.1|PINH|DOR | ||
| Type: protein-coding gene | Cytoband: 20q11.22 | ||
| Entrez ID: 58476 | HGNC ID: HGNC:16104 | Ensembl Gene: ENSG00000078804 | OMIM ID: 617549 |
Expression of TP53INP2:
| Dataset | Gene | EntrezID | Probe | Log2FC | Adj.pValue | Expression |
|---|---|---|---|---|---|---|
| GSE17351 | TP53INP2 | 58476 | 224836_at | -1.1838 | 0.1168 | |
| GSE26886 | TP53INP2 | 58476 | 224836_at | -3.2787 | 0.0000 | |
| GSE45670 | TP53INP2 | 58476 | 224836_at | -0.8442 | 0.0799 | |
| GSE53622 | TP53INP2 | 58476 | 73920 | -2.2273 | 0.0000 | |
| GSE53624 | TP53INP2 | 58476 | 73920 | -1.9492 | 0.0000 | |
| GSE63941 | TP53INP2 | 58476 | 224836_at | -1.1651 | 0.1091 | |
| GSE77861 | TP53INP2 | 58476 | 224836_at | -1.1598 | 0.0132 | |
| GSE97050 | TP53INP2 | 58476 | A_24_P357465 | -1.5136 | 0.0867 | |
| SRP007169 | TP53INP2 | 58476 | RNAseq | -2.0399 | 0.0062 | |
| SRP008496 | TP53INP2 | 58476 | RNAseq | -3.0219 | 0.0000 | |
| SRP064894 | TP53INP2 | 58476 | RNAseq | -2.2224 | 0.0000 | |
| SRP133303 | TP53INP2 | 58476 | RNAseq | -1.5525 | 0.0000 | |
| SRP159526 | TP53INP2 | 58476 | RNAseq | -2.8171 | 0.0000 | |
| SRP193095 | TP53INP2 | 58476 | RNAseq | -2.6451 | 0.0000 | |
| SRP219564 | TP53INP2 | 58476 | RNAseq | -1.7556 | 0.0031 | |
| TCGA | TP53INP2 | 58476 | RNAseq | -0.3463 | 0.0007 |
Upregulated datasets: 0; Downregulated datasets: 11.
Survival by TP53INP2 expression:
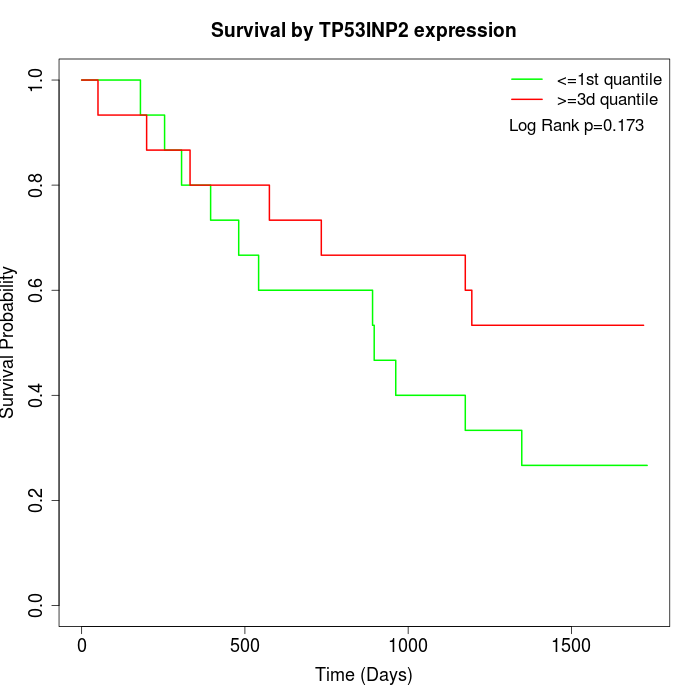 | 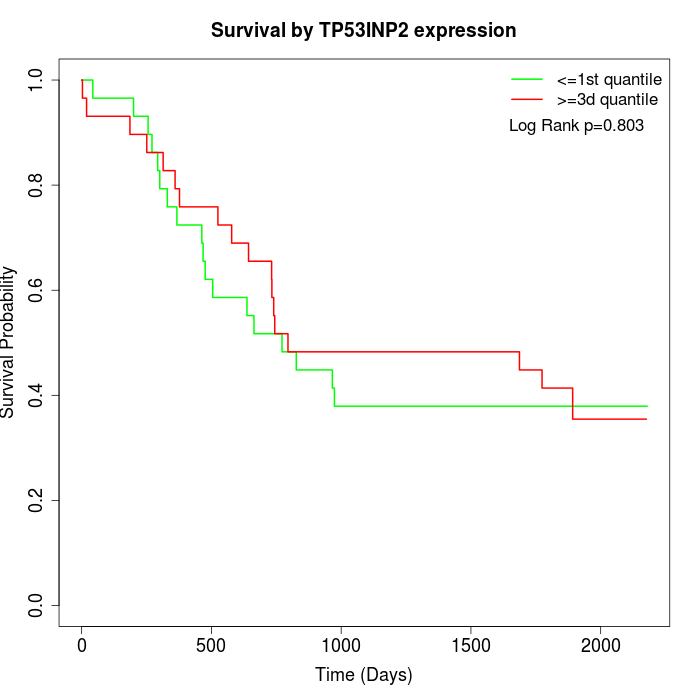 | 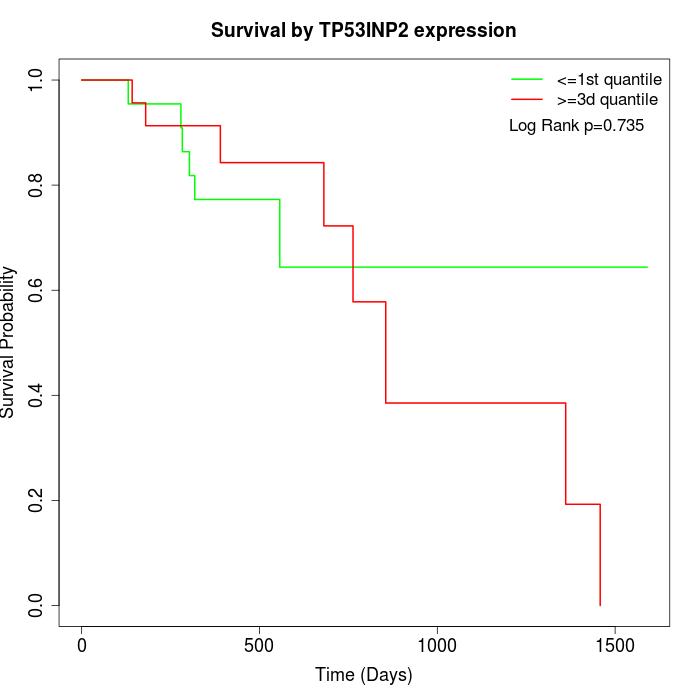 |
| GSE53622 | GSE53624 | TCGA |
Note: Click image to view full size file.
Copy number change of TP53INP2:
| Dataset | Gene | EntrezID | Gain | Loss | Normal | Detail |
|---|---|---|---|---|---|---|
| GSE15526 | TP53INP2 | 58476 | 16 | 0 | 14 | |
| GSE20123 | TP53INP2 | 58476 | 16 | 0 | 14 | |
| GSE43470 | TP53INP2 | 58476 | 12 | 0 | 31 | |
| GSE46452 | TP53INP2 | 58476 | 29 | 0 | 30 | |
| GSE47630 | TP53INP2 | 58476 | 24 | 1 | 15 | |
| GSE54993 | TP53INP2 | 58476 | 0 | 18 | 52 | |
| GSE54994 | TP53INP2 | 58476 | 25 | 1 | 27 | |
| GSE60625 | TP53INP2 | 58476 | 0 | 0 | 11 | |
| GSE74703 | TP53INP2 | 58476 | 11 | 0 | 25 | |
| GSE74704 | TP53INP2 | 58476 | 11 | 0 | 9 | |
| TCGA | TP53INP2 | 58476 | 50 | 2 | 44 |
Total number of gains: 194; Total number of losses: 22; Total Number of normals: 272.
Somatic mutations of TP53INP2:
Generating mutation plots.
Highly correlated genes for TP53INP2:
Showing top 20/1383 corelated genes with mean PCC>0.5.
| Gene1 | Gene2 | Mean PCC | Num. Datasets | Num. PCC<0 | Num. PCC>0.5 |
|---|---|---|---|---|---|
| TP53INP2 | PRSS2 | 0.853674 | 3 | 0 | 3 |
| TP53INP2 | MYZAP | 0.850864 | 3 | 0 | 3 |
| TP53INP2 | SLC13A4 | 0.834161 | 5 | 0 | 5 |
| TP53INP2 | ZNRF1 | 0.828248 | 3 | 0 | 3 |
| TP53INP2 | IKZF2 | 0.82303 | 6 | 0 | 6 |
| TP53INP2 | SLC16A6 | 0.81428 | 5 | 0 | 5 |
| TP53INP2 | CAPN14 | 0.813708 | 5 | 0 | 5 |
| TP53INP2 | SMIM5 | 0.810365 | 6 | 0 | 6 |
| TP53INP2 | SERPINB1 | 0.809443 | 5 | 0 | 5 |
| TP53INP2 | SLC12A6 | 0.804113 | 3 | 0 | 3 |
| TP53INP2 | SPAG17 | 0.800745 | 3 | 0 | 3 |
| TP53INP2 | SNORA68 | 0.799773 | 4 | 0 | 4 |
| TP53INP2 | VSIG10L | 0.799493 | 6 | 0 | 5 |
| TP53INP2 | PRSS3 | 0.799049 | 5 | 0 | 5 |
| TP53INP2 | CLINT1 | 0.795602 | 5 | 0 | 5 |
| TP53INP2 | MAL | 0.795052 | 7 | 0 | 7 |
| TP53INP2 | SH3BGRL2 | 0.791966 | 7 | 0 | 6 |
| TP53INP2 | MIEF2 | 0.789655 | 6 | 0 | 6 |
| TP53INP2 | OSTF1 | 0.787085 | 5 | 0 | 5 |
| TP53INP2 | ARHGAP27 | 0.784169 | 6 | 0 | 6 |
For details and further investigation, click here