| Full name: S100 calcium binding protein A16 | Alias Symbol: S100F|DT1P1A7|MGC17528 | ||
| Type: protein-coding gene | Cytoband: 1q21.3 | ||
| Entrez ID: 140576 | HGNC ID: HGNC:20441 | Ensembl Gene: ENSG00000188643 | OMIM ID: 617437 |
Screen Evidence:
| |||
Expression of S100A16:
| Dataset | Gene | EntrezID | Probe | Log2FC | Adj.pValue | Expression |
|---|---|---|---|---|---|---|
| GSE17351 | S100A16 | 140576 | 227998_at | -0.5440 | 0.3728 | |
| GSE26886 | S100A16 | 140576 | 227998_at | -2.0990 | 0.0000 | |
| GSE45670 | S100A16 | 140576 | 227998_at | -0.4065 | 0.0305 | |
| GSE53622 | S100A16 | 140576 | 50405 | -1.4674 | 0.0000 | |
| GSE53624 | S100A16 | 140576 | 50405 | -1.7523 | 0.0000 | |
| GSE63941 | S100A16 | 140576 | 227998_at | 0.8344 | 0.2895 | |
| GSE77861 | S100A16 | 140576 | 227998_at | -0.7571 | 0.0042 | |
| GSE97050 | S100A16 | 140576 | A_23_P147918 | -0.1448 | 0.8945 | |
| SRP007169 | S100A16 | 140576 | RNAseq | -4.1291 | 0.0000 | |
| SRP008496 | S100A16 | 140576 | RNAseq | -3.7161 | 0.0000 | |
| SRP064894 | S100A16 | 140576 | RNAseq | -2.3363 | 0.0000 | |
| SRP133303 | S100A16 | 140576 | RNAseq | -2.0750 | 0.0000 | |
| SRP159526 | S100A16 | 140576 | RNAseq | -2.5460 | 0.0000 | |
| SRP193095 | S100A16 | 140576 | RNAseq | -2.3322 | 0.0000 | |
| SRP219564 | S100A16 | 140576 | RNAseq | -2.0963 | 0.0108 | |
| TCGA | S100A16 | 140576 | RNAseq | 0.3376 | 0.0002 |
Upregulated datasets: 0; Downregulated datasets: 10.
Survival by S100A16 expression:
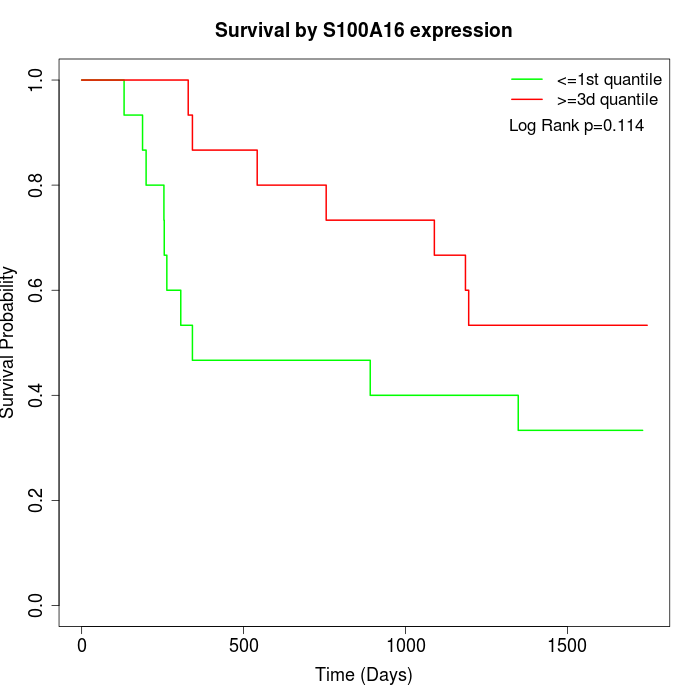 | 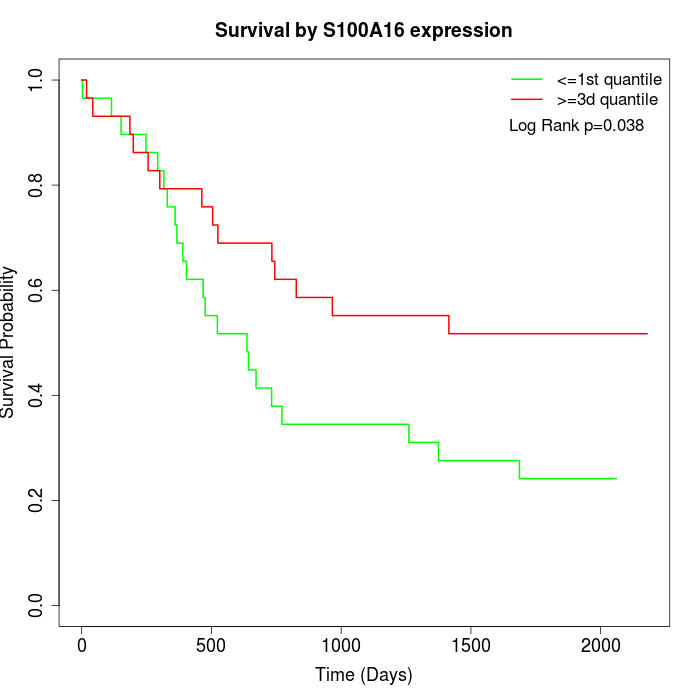 | 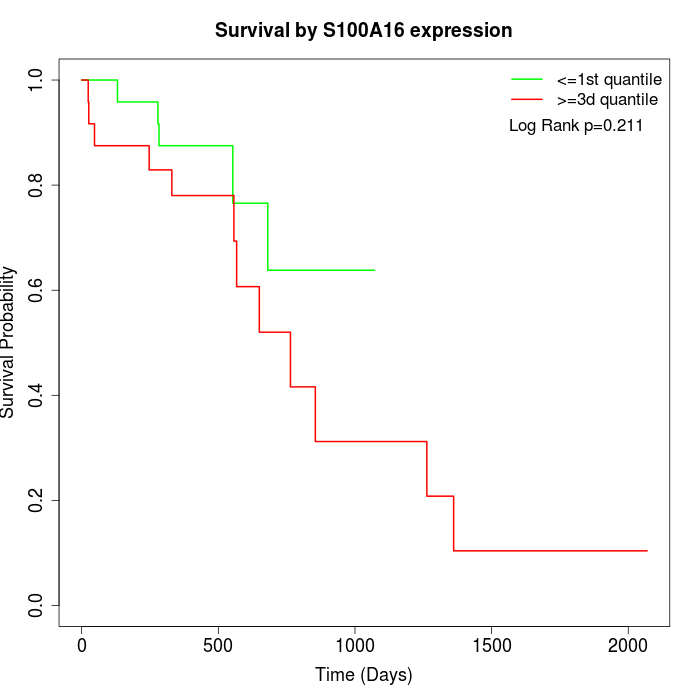 |
| GSE53622 | GSE53624 | TCGA |
Note: Click image to view full size file.
Copy number change of S100A16:
| Dataset | Gene | EntrezID | Gain | Loss | Normal | Detail |
|---|---|---|---|---|---|---|
| GSE15526 | S100A16 | 140576 | 14 | 0 | 16 | |
| GSE20123 | S100A16 | 140576 | 14 | 0 | 16 | |
| GSE43470 | S100A16 | 140576 | 7 | 2 | 34 | |
| GSE46452 | S100A16 | 140576 | 2 | 1 | 56 | |
| GSE47630 | S100A16 | 140576 | 14 | 0 | 26 | |
| GSE54993 | S100A16 | 140576 | 0 | 4 | 66 | |
| GSE54994 | S100A16 | 140576 | 16 | 0 | 37 | |
| GSE60625 | S100A16 | 140576 | 0 | 0 | 11 | |
| GSE74703 | S100A16 | 140576 | 6 | 1 | 29 | |
| GSE74704 | S100A16 | 140576 | 7 | 0 | 13 | |
| TCGA | S100A16 | 140576 | 38 | 2 | 56 |
Total number of gains: 118; Total number of losses: 10; Total Number of normals: 360.
Somatic mutations of S100A16:
Generating mutation plots.
Highly correlated genes for S100A16:
Showing top 20/1582 corelated genes with mean PCC>0.5.
| Gene1 | Gene2 | Mean PCC | Num. Datasets | Num. PCC<0 | Num. PCC>0.5 |
|---|---|---|---|---|---|
| S100A16 | EVPL | 0.913859 | 7 | 0 | 7 |
| S100A16 | CSTB | 0.873459 | 8 | 0 | 8 |
| S100A16 | CYSRT1 | 0.871645 | 6 | 0 | 6 |
| S100A16 | BTBD11 | 0.867508 | 7 | 0 | 7 |
| S100A16 | S100A14 | 0.848307 | 9 | 0 | 9 |
| S100A16 | IL18 | 0.844249 | 7 | 0 | 7 |
| S100A16 | GRHL3 | 0.836915 | 8 | 0 | 8 |
| S100A16 | C5orf66-AS1 | 0.830588 | 6 | 0 | 6 |
| S100A16 | IL1RN | 0.830431 | 8 | 0 | 7 |
| S100A16 | MALL | 0.828377 | 9 | 0 | 8 |
| S100A16 | TP53I3 | 0.827974 | 7 | 0 | 7 |
| S100A16 | TMEM154 | 0.823957 | 8 | 0 | 7 |
| S100A16 | ANXA1 | 0.821325 | 8 | 0 | 7 |
| S100A16 | GPR157 | 0.821118 | 7 | 0 | 7 |
| S100A16 | PADI1 | 0.820516 | 4 | 0 | 4 |
| S100A16 | ZNF185 | 0.819528 | 9 | 0 | 9 |
| S100A16 | PKP3 | 0.819032 | 8 | 0 | 8 |
| S100A16 | RBM47 | 0.818578 | 7 | 0 | 7 |
| S100A16 | PDLIM2 | 0.818133 | 4 | 0 | 4 |
| S100A16 | EPS8L2 | 0.815989 | 7 | 0 | 6 |
For details and further investigation, click here