| Full name: actin alpha cardiac muscle 1 | Alias Symbol: CMD1R | ||
| Type: protein-coding gene | Cytoband: 15q14 | ||
| Entrez ID: 70 | HGNC ID: HGNC:143 | Ensembl Gene: ENSG00000159251 | OMIM ID: 102540 |
| Related drugs: DEXAMETHASONE... [more] | |||
ACTC1 involved pathways:
| KEGG pathway | Description | View |
|---|---|---|
| hsa04261 | Adrenergic signaling in cardiomyocytes |
Expression of ACTC1:
| Dataset | Gene | EntrezID | Probe | Log2FC | Adj.pValue | Expression |
|---|---|---|---|---|---|---|
| GSE17351 | ACTC1 | 70 | 205132_at | -0.9320 | 0.4729 | |
| GSE20347 | ACTC1 | 70 | 205132_at | -0.2393 | 0.2637 | |
| GSE23400 | ACTC1 | 70 | 205132_at | -0.2002 | 0.0821 | |
| GSE26886 | ACTC1 | 70 | 205132_at | 0.6996 | 0.0743 | |
| GSE29001 | ACTC1 | 70 | 205132_at | -0.0996 | 0.8140 | |
| GSE38129 | ACTC1 | 70 | 205132_at | -0.7187 | 0.0638 | |
| GSE45670 | ACTC1 | 70 | 205132_at | -2.1326 | 0.0000 | |
| GSE53622 | ACTC1 | 70 | 26750 | -0.1952 | 0.4518 | |
| GSE53624 | ACTC1 | 70 | 26750 | -0.3815 | 0.0014 | |
| GSE63941 | ACTC1 | 70 | 205132_at | -2.4493 | 0.0000 | |
| GSE77861 | ACTC1 | 70 | 205132_at | 0.0850 | 0.4897 | |
| SRP064894 | ACTC1 | 70 | RNAseq | -1.1087 | 0.0163 | |
| SRP133303 | ACTC1 | 70 | RNAseq | -0.8829 | 0.3395 | |
| TCGA | ACTC1 | 70 | RNAseq | -0.6061 | 0.2189 |
Upregulated datasets: 0; Downregulated datasets: 3.
Survival by ACTC1 expression:
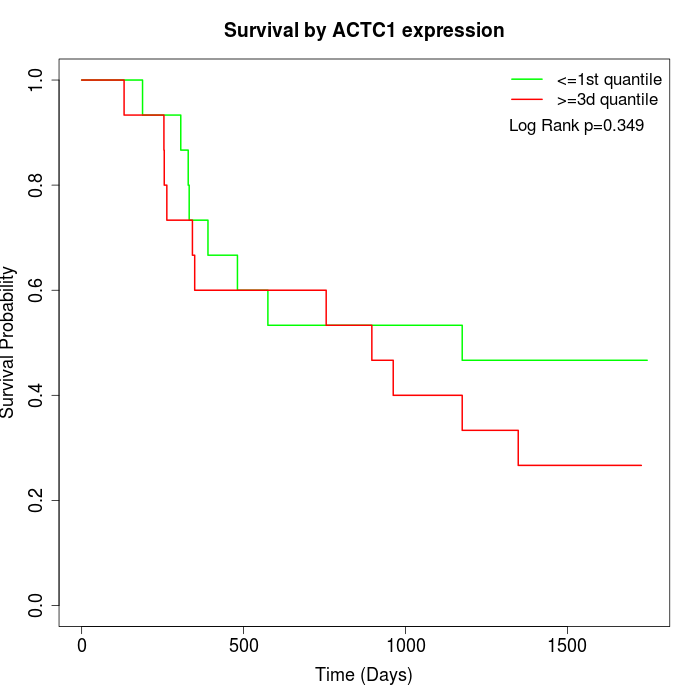 | 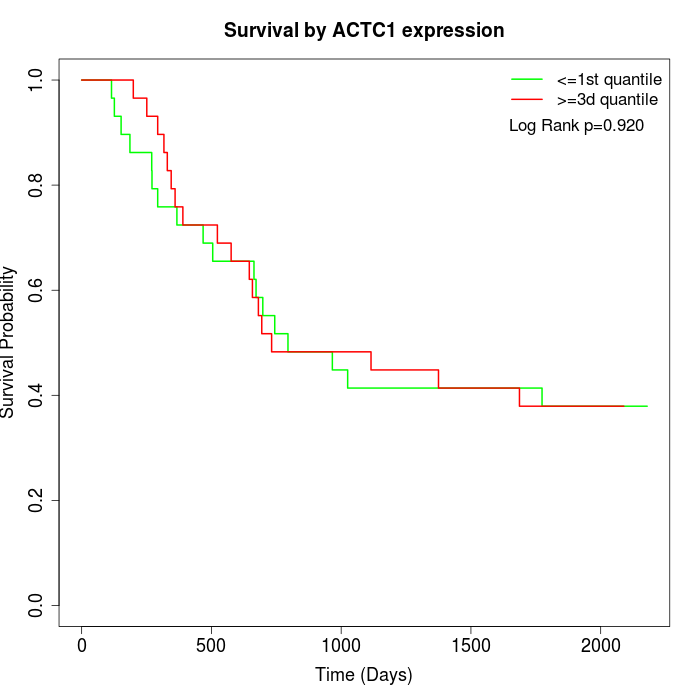 | 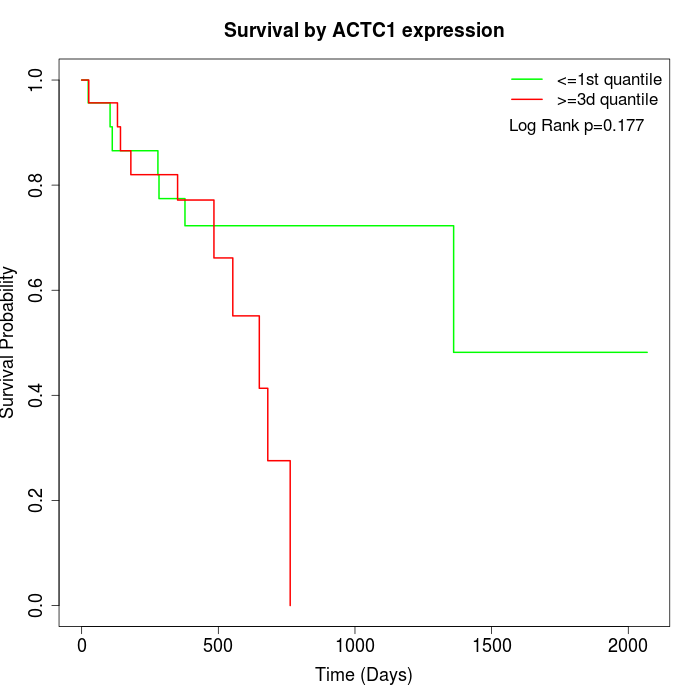 |
| GSE53622 | GSE53624 | TCGA |
Note: Click image to view full size file.
Copy number change of ACTC1:
| Dataset | Gene | EntrezID | Gain | Loss | Normal | Detail |
|---|---|---|---|---|---|---|
| GSE15526 | ACTC1 | 70 | 3 | 6 | 21 | |
| GSE20123 | ACTC1 | 70 | 3 | 6 | 21 | |
| GSE43470 | ACTC1 | 70 | 4 | 4 | 35 | |
| GSE46452 | ACTC1 | 70 | 3 | 7 | 49 | |
| GSE47630 | ACTC1 | 70 | 8 | 11 | 21 | |
| GSE54993 | ACTC1 | 70 | 4 | 6 | 60 | |
| GSE54994 | ACTC1 | 70 | 5 | 8 | 40 | |
| GSE60625 | ACTC1 | 70 | 4 | 0 | 7 | |
| GSE74703 | ACTC1 | 70 | 4 | 3 | 29 | |
| GSE74704 | ACTC1 | 70 | 2 | 5 | 13 | |
| TCGA | ACTC1 | 70 | 13 | 18 | 65 |
Total number of gains: 53; Total number of losses: 74; Total Number of normals: 361.
Somatic mutations of ACTC1:
Generating mutation plots.
Highly correlated genes for ACTC1:
Showing top 20/651 corelated genes with mean PCC>0.5.
| Gene1 | Gene2 | Mean PCC | Num. Datasets | Num. PCC<0 | Num. PCC>0.5 |
|---|---|---|---|---|---|
| ACTC1 | MAGI2-AS3 | 0.796838 | 3 | 0 | 3 |
| ACTC1 | SMOC2 | 0.770348 | 3 | 0 | 3 |
| ACTC1 | RBM24 | 0.770194 | 3 | 0 | 3 |
| ACTC1 | NEGR1 | 0.767597 | 3 | 0 | 3 |
| ACTC1 | MRVI1 | 0.763259 | 5 | 0 | 5 |
| ACTC1 | FIBIN | 0.761077 | 3 | 0 | 3 |
| ACTC1 | MRGPRF | 0.759614 | 4 | 0 | 4 |
| ACTC1 | GNG7 | 0.759365 | 3 | 0 | 3 |
| ACTC1 | MIR100HG | 0.758403 | 4 | 0 | 4 |
| ACTC1 | MICU3 | 0.741666 | 3 | 0 | 3 |
| ACTC1 | ZBTB47 | 0.737678 | 4 | 0 | 4 |
| ACTC1 | BHMT2 | 0.737352 | 7 | 0 | 7 |
| ACTC1 | TBX5 | 0.736232 | 3 | 0 | 3 |
| ACTC1 | PRICKLE2 | 0.73599 | 3 | 0 | 3 |
| ACTC1 | ACTA2 | 0.73555 | 10 | 0 | 9 |
| ACTC1 | SLC4A4 | 0.735272 | 3 | 0 | 3 |
| ACTC1 | ACTG2 | 0.734164 | 10 | 0 | 9 |
| ACTC1 | ARHGAP6 | 0.729646 | 6 | 0 | 6 |
| ACTC1 | NOG | 0.729155 | 3 | 0 | 3 |
| ACTC1 | ADAMTS5 | 0.72176 | 7 | 0 | 7 |
For details and further investigation, click here