| Full name: prostate transmembrane protein, androgen induced 1 | Alias Symbol: STAG1 | ||
| Type: protein-coding gene | Cytoband: 20q13.31 | ||
| Entrez ID: 56937 | HGNC ID: HGNC:14107 | Ensembl Gene: ENSG00000124225 | OMIM ID: 606564 |
Expression of PMEPA1:
| Dataset | Gene | EntrezID | Probe | Log2FC | Adj.pValue | Expression |
|---|---|---|---|---|---|---|
| GSE17351 | PMEPA1 | 56937 | 222450_at | 1.1304 | 0.2327 | |
| GSE20347 | PMEPA1 | 56937 | 217875_s_at | 1.4958 | 0.0000 | |
| GSE23400 | PMEPA1 | 56937 | 217875_s_at | 1.2123 | 0.0000 | |
| GSE26886 | PMEPA1 | 56937 | 222450_at | 3.4737 | 0.0000 | |
| GSE29001 | PMEPA1 | 56937 | 217875_s_at | 1.5164 | 0.0032 | |
| GSE38129 | PMEPA1 | 56937 | 217875_s_at | 1.5828 | 0.0001 | |
| GSE45670 | PMEPA1 | 56937 | 222449_at | 1.3639 | 0.0143 | |
| GSE53622 | PMEPA1 | 56937 | 33598 | 1.7485 | 0.0000 | |
| GSE53624 | PMEPA1 | 56937 | 33598 | 1.9483 | 0.0000 | |
| GSE63941 | PMEPA1 | 56937 | 222450_at | -0.2379 | 0.9036 | |
| GSE77861 | PMEPA1 | 56937 | 217875_s_at | 0.7922 | 0.1447 | |
| GSE97050 | PMEPA1 | 56937 | A_33_P3403867 | 0.9493 | 0.1998 | |
| SRP007169 | PMEPA1 | 56937 | RNAseq | 3.3355 | 0.0000 | |
| SRP008496 | PMEPA1 | 56937 | RNAseq | 3.6396 | 0.0000 | |
| SRP064894 | PMEPA1 | 56937 | RNAseq | 2.2624 | 0.0000 | |
| SRP133303 | PMEPA1 | 56937 | RNAseq | 2.5141 | 0.0000 | |
| SRP159526 | PMEPA1 | 56937 | RNAseq | 2.5720 | 0.0002 | |
| SRP193095 | PMEPA1 | 56937 | RNAseq | 3.3646 | 0.0000 | |
| SRP219564 | PMEPA1 | 56937 | RNAseq | 1.6009 | 0.0251 | |
| TCGA | PMEPA1 | 56937 | RNAseq | 0.4062 | 0.0002 |
Upregulated datasets: 15; Downregulated datasets: 0.
Survival by PMEPA1 expression:
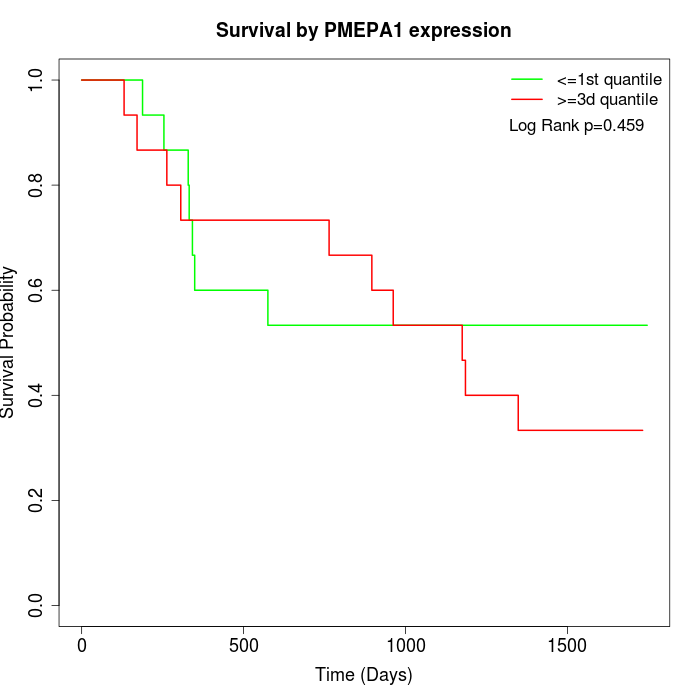 | 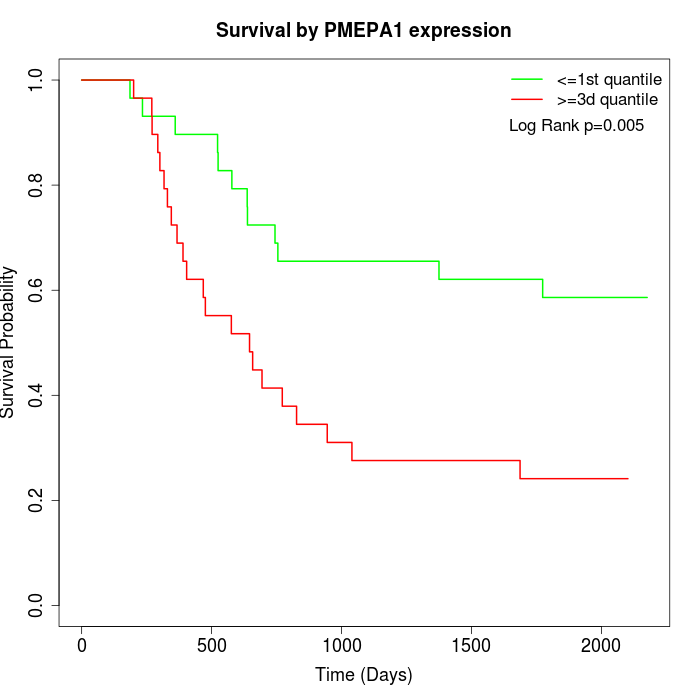 | 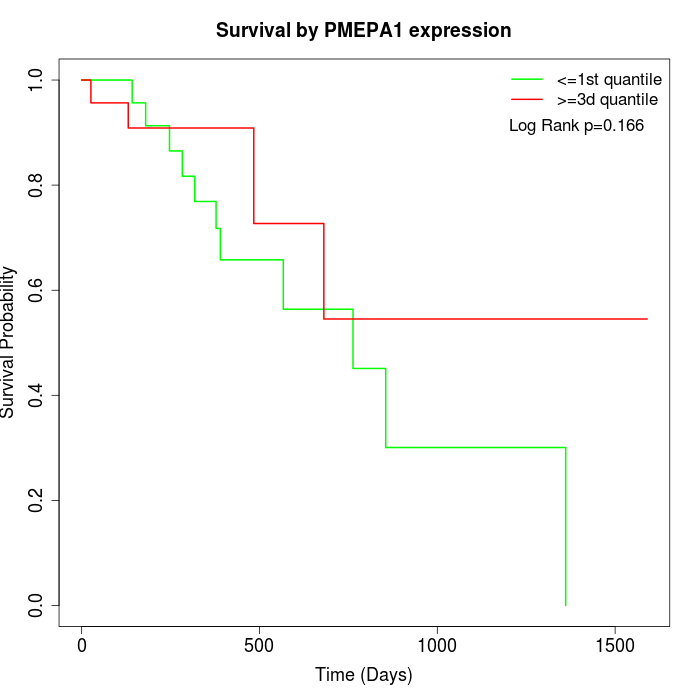 |
| GSE53622 | GSE53624 | TCGA |
Note: Click image to view full size file.
Copy number change of PMEPA1:
| Dataset | Gene | EntrezID | Gain | Loss | Normal | Detail |
|---|---|---|---|---|---|---|
| GSE15526 | PMEPA1 | 56937 | 14 | 2 | 14 | |
| GSE20123 | PMEPA1 | 56937 | 14 | 2 | 14 | |
| GSE43470 | PMEPA1 | 56937 | 13 | 0 | 30 | |
| GSE46452 | PMEPA1 | 56937 | 29 | 0 | 30 | |
| GSE47630 | PMEPA1 | 56937 | 24 | 1 | 15 | |
| GSE54993 | PMEPA1 | 56937 | 0 | 17 | 53 | |
| GSE54994 | PMEPA1 | 56937 | 29 | 0 | 24 | |
| GSE60625 | PMEPA1 | 56937 | 0 | 0 | 11 | |
| GSE74703 | PMEPA1 | 56937 | 11 | 0 | 25 | |
| GSE74704 | PMEPA1 | 56937 | 11 | 0 | 9 | |
| TCGA | PMEPA1 | 56937 | 43 | 4 | 49 |
Total number of gains: 188; Total number of losses: 26; Total Number of normals: 274.
Somatic mutations of PMEPA1:
Generating mutation plots.
Highly correlated genes for PMEPA1:
Showing top 20/746 corelated genes with mean PCC>0.5.
| Gene1 | Gene2 | Mean PCC | Num. Datasets | Num. PCC<0 | Num. PCC>0.5 |
|---|---|---|---|---|---|
| PMEPA1 | INHBA | 0.858908 | 10 | 0 | 10 |
| PMEPA1 | LOXL2 | 0.799272 | 11 | 0 | 10 |
| PMEPA1 | COL5A2 | 0.777125 | 11 | 0 | 11 |
| PMEPA1 | COL5A1 | 0.772272 | 12 | 0 | 11 |
| PMEPA1 | COL27A1 | 0.770881 | 7 | 0 | 7 |
| PMEPA1 | TGFBI | 0.75831 | 12 | 0 | 10 |
| PMEPA1 | BGN | 0.755426 | 11 | 0 | 11 |
| PMEPA1 | HOMER3 | 0.74926 | 11 | 0 | 11 |
| PMEPA1 | CTHRC1 | 0.74607 | 7 | 0 | 7 |
| PMEPA1 | MFAP2 | 0.745195 | 12 | 0 | 11 |
| PMEPA1 | CD276 | 0.739437 | 5 | 0 | 5 |
| PMEPA1 | SERPINH1 | 0.736522 | 12 | 0 | 10 |
| PMEPA1 | FAP | 0.735126 | 9 | 0 | 9 |
| PMEPA1 | ANXA10 | 0.729762 | 3 | 0 | 3 |
| PMEPA1 | HTRA1 | 0.729747 | 11 | 0 | 11 |
| PMEPA1 | SNAI2 | 0.729736 | 10 | 0 | 9 |
| PMEPA1 | PDGFA | 0.728735 | 11 | 0 | 10 |
| PMEPA1 | ACVR2B | 0.726907 | 3 | 0 | 3 |
| PMEPA1 | LAMB3 | 0.723813 | 9 | 0 | 9 |
| PMEPA1 | ABCC2 | 0.722741 | 3 | 0 | 3 |
For details and further investigation, click here