| Full name: annexin A13 | Alias Symbol: | ||
| Type: protein-coding gene | Cytoband: 8q24.13 | ||
| Entrez ID: 312 | HGNC ID: HGNC:536 | Ensembl Gene: ENSG00000104537 | OMIM ID: 602573 |
Expression of ANXA13:
| Dataset | Gene | EntrezID | Probe | Log2FC | Adj.pValue | Expression |
|---|---|---|---|---|---|---|
| GSE17351 | ANXA13 | 312 | 208323_s_at | 0.1870 | 0.5479 | |
| GSE20347 | ANXA13 | 312 | 208323_s_at | 0.0763 | 0.3819 | |
| GSE23400 | ANXA13 | 312 | 208323_s_at | -0.1136 | 0.0010 | |
| GSE26886 | ANXA13 | 312 | 208323_s_at | 0.1635 | 0.1833 | |
| GSE29001 | ANXA13 | 312 | 208323_s_at | -0.0524 | 0.8302 | |
| GSE38129 | ANXA13 | 312 | 208323_s_at | -0.1300 | 0.2929 | |
| GSE45670 | ANXA13 | 312 | 208323_s_at | 0.0557 | 0.7519 | |
| GSE53622 | ANXA13 | 312 | 16116 | 0.7095 | 0.0022 | |
| GSE53624 | ANXA13 | 312 | 16116 | 0.5363 | 0.0076 | |
| GSE63941 | ANXA13 | 312 | 208323_s_at | 0.1499 | 0.2679 | |
| GSE77861 | ANXA13 | 312 | 208323_s_at | -0.0894 | 0.6854 | |
| GSE97050 | ANXA13 | 312 | A_23_P60009 | 0.0157 | 0.9581 | |
| TCGA | ANXA13 | 312 | RNAseq | -0.3962 | 0.4813 |
Upregulated datasets: 0; Downregulated datasets: 0.
Survival by ANXA13 expression:
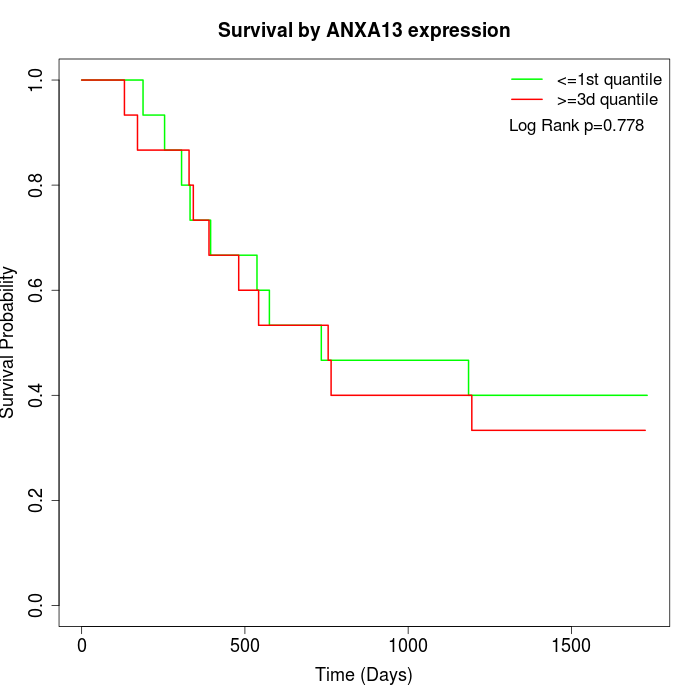 | 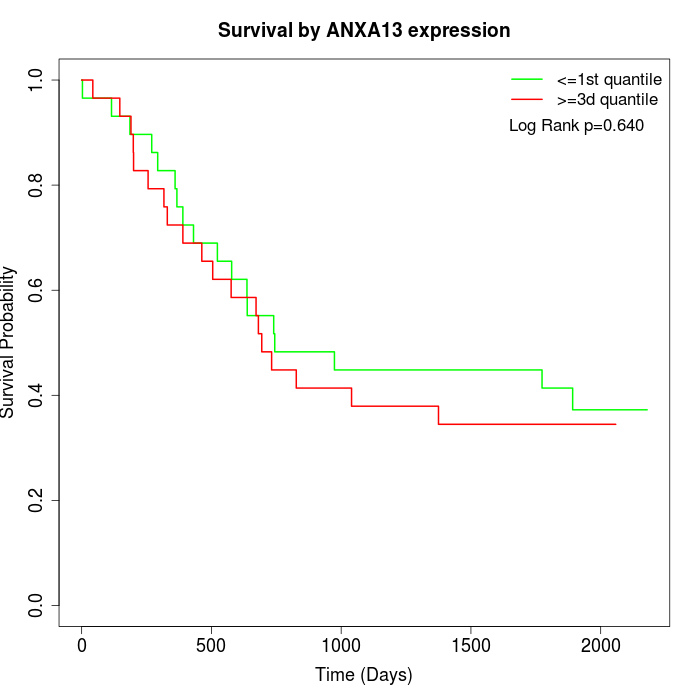 | 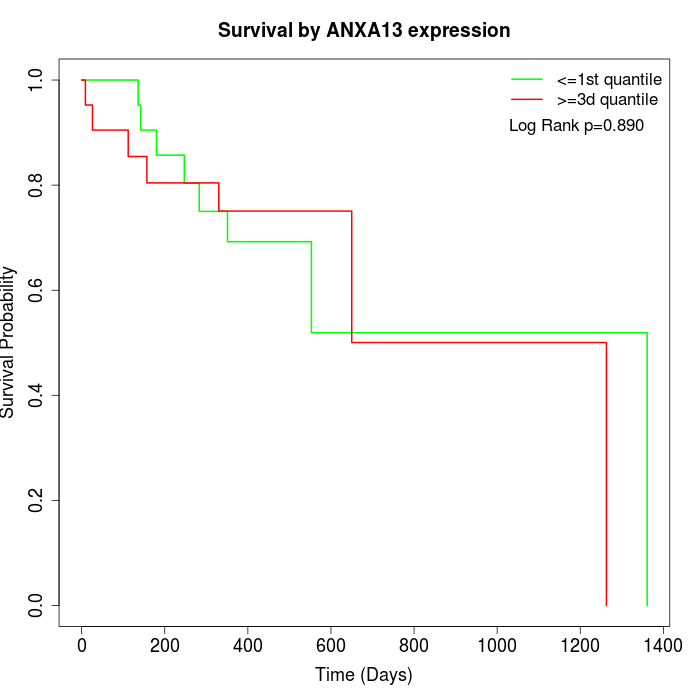 |
| GSE53622 | GSE53624 | TCGA |
Note: Click image to view full size file.
Copy number change of ANXA13:
| Dataset | Gene | EntrezID | Gain | Loss | Normal | Detail |
|---|---|---|---|---|---|---|
| GSE15526 | ANXA13 | 312 | 19 | 0 | 11 | |
| GSE20123 | ANXA13 | 312 | 20 | 0 | 10 | |
| GSE43470 | ANXA13 | 312 | 22 | 0 | 21 | |
| GSE46452 | ANXA13 | 312 | 27 | 0 | 32 | |
| GSE47630 | ANXA13 | 312 | 24 | 0 | 16 | |
| GSE54993 | ANXA13 | 312 | 0 | 21 | 49 | |
| GSE54994 | ANXA13 | 312 | 37 | 1 | 15 | |
| GSE60625 | ANXA13 | 312 | 0 | 4 | 7 | |
| GSE74703 | ANXA13 | 312 | 19 | 0 | 17 | |
| GSE74704 | ANXA13 | 312 | 13 | 0 | 7 | |
| TCGA | ANXA13 | 312 | 67 | 1 | 28 |
Total number of gains: 248; Total number of losses: 27; Total Number of normals: 213.
Somatic mutations of ANXA13:
Generating mutation plots.
Highly correlated genes for ANXA13:
Showing top 20/481 corelated genes with mean PCC>0.5.
| Gene1 | Gene2 | Mean PCC | Num. Datasets | Num. PCC<0 | Num. PCC>0.5 |
|---|---|---|---|---|---|
| ANXA13 | MARVELD1 | 0.73587 | 3 | 0 | 3 |
| ANXA13 | PCDH10 | 0.724339 | 3 | 0 | 3 |
| ANXA13 | CALCB | 0.675618 | 3 | 0 | 3 |
| ANXA13 | SLC12A4 | 0.670705 | 4 | 0 | 4 |
| ANXA13 | ART1 | 0.653762 | 4 | 0 | 4 |
| ANXA13 | LBP | 0.651779 | 4 | 0 | 4 |
| ANXA13 | SLC6A20 | 0.650708 | 3 | 0 | 3 |
| ANXA13 | KIR2DL2 | 0.647963 | 4 | 0 | 4 |
| ANXA13 | RNF185-AS1 | 0.646512 | 4 | 0 | 3 |
| ANXA13 | CYP2A7 | 0.641113 | 4 | 0 | 4 |
| ANXA13 | SAG | 0.639113 | 5 | 0 | 4 |
| ANXA13 | CAMK2B | 0.637099 | 4 | 0 | 4 |
| ANXA13 | C1QL1 | 0.636731 | 5 | 0 | 5 |
| ANXA13 | GPBAR1 | 0.634791 | 3 | 0 | 3 |
| ANXA13 | OR10H3 | 0.634124 | 5 | 0 | 5 |
| ANXA13 | KCNA1 | 0.633919 | 4 | 0 | 4 |
| ANXA13 | L1CAM | 0.633803 | 5 | 0 | 4 |
| ANXA13 | PRL | 0.630322 | 5 | 0 | 4 |
| ANXA13 | PAX3 | 0.629793 | 3 | 0 | 3 |
| ANXA13 | IRS4 | 0.628918 | 4 | 0 | 4 |
For details and further investigation, click here