| Full name: adaptor related protein complex 1 subunit gamma 2 | Alias Symbol: G2AD | ||
| Type: protein-coding gene | Cytoband: 14q11.2 | ||
| Entrez ID: 8906 | HGNC ID: HGNC:556 | Ensembl Gene: ENSG00000213983 | OMIM ID: 603534 |
| Drug and gene relationship at DGIdb | |||
Expression of AP1G2:
| Dataset | Gene | EntrezID | Probe | Log2FC | Adj.pValue | Expression |
|---|---|---|---|---|---|---|
| GSE17351 | AP1G2 | 8906 | 201613_s_at | 0.4354 | 0.7000 | |
| GSE20347 | AP1G2 | 8906 | 201613_s_at | 0.0760 | 0.6985 | |
| GSE23400 | AP1G2 | 8906 | 201613_s_at | 0.3603 | 0.0002 | |
| GSE26886 | AP1G2 | 8906 | 201613_s_at | 0.1301 | 0.5436 | |
| GSE29001 | AP1G2 | 8906 | 201613_s_at | 0.2349 | 0.5040 | |
| GSE38129 | AP1G2 | 8906 | 201613_s_at | 0.2893 | 0.2192 | |
| GSE45670 | AP1G2 | 8906 | 201613_s_at | 0.3931 | 0.0149 | |
| GSE53622 | AP1G2 | 8906 | 140664 | -1.8716 | 0.0000 | |
| GSE53624 | AP1G2 | 8906 | 140664 | -2.2387 | 0.0000 | |
| GSE63941 | AP1G2 | 8906 | 201613_s_at | 2.6755 | 0.0002 | |
| GSE77861 | AP1G2 | 8906 | 201613_s_at | 0.0890 | 0.7273 | |
| GSE97050 | AP1G2 | 8906 | A_23_P2967 | 0.8976 | 0.1800 | |
| SRP007169 | AP1G2 | 8906 | RNAseq | -0.7678 | 0.0185 | |
| SRP008496 | AP1G2 | 8906 | RNAseq | -0.7000 | 0.0003 | |
| SRP064894 | AP1G2 | 8906 | RNAseq | 0.7205 | 0.0020 | |
| SRP133303 | AP1G2 | 8906 | RNAseq | 0.0662 | 0.7552 | |
| SRP159526 | AP1G2 | 8906 | RNAseq | -0.2847 | 0.3635 | |
| SRP193095 | AP1G2 | 8906 | RNAseq | 0.0991 | 0.4797 | |
| SRP219564 | AP1G2 | 8906 | RNAseq | 0.5100 | 0.4365 | |
| TCGA | AP1G2 | 8906 | RNAseq | 0.1175 | 0.0717 |
Upregulated datasets: 1; Downregulated datasets: 2.
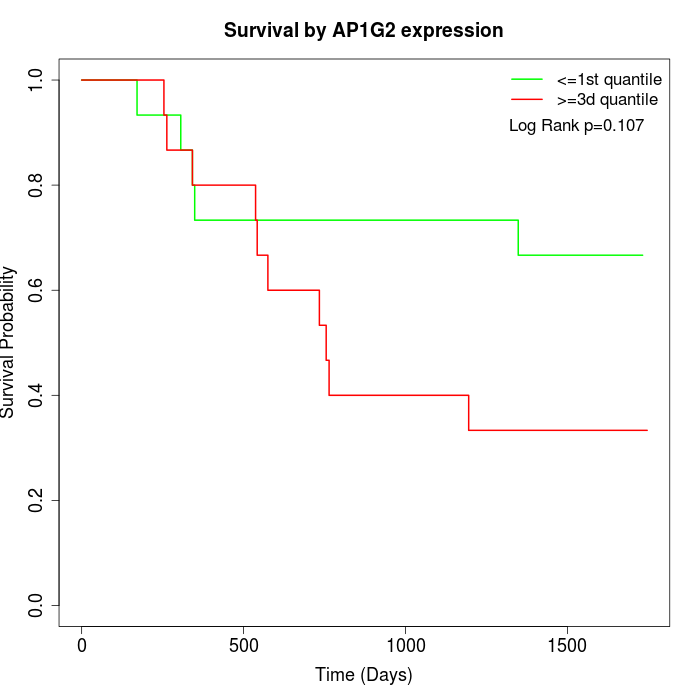
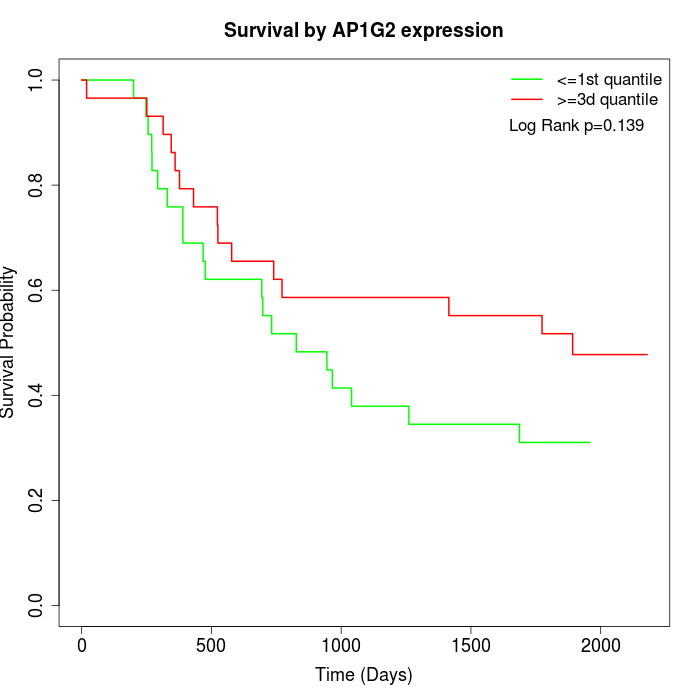
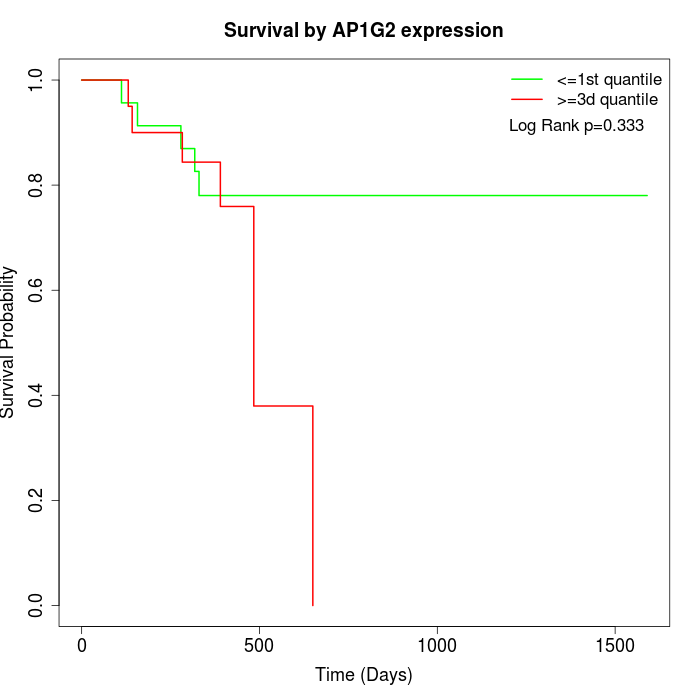
Survival by AP1G2 expression:
Note: Click image to view full size file.
Copy number change of AP1G2:
| Dataset | Gene | EntrezID | Gain | Loss | Normal | Detail |
|---|---|---|---|---|---|---|
| GSE15526 | AP1G2 | 8906 | 8 | 1 | 21 | |
| GSE20123 | AP1G2 | 8906 | 8 | 1 | 21 | |
| GSE43470 | AP1G2 | 8906 | 7 | 2 | 34 | |
| GSE46452 | AP1G2 | 8906 | 17 | 2 | 40 | |
| GSE47630 | AP1G2 | 8906 | 11 | 10 | 19 | |
| GSE54993 | AP1G2 | 8906 | 3 | 11 | 56 | |
| GSE54994 | AP1G2 | 8906 | 18 | 5 | 30 | |
| GSE60625 | AP1G2 | 8906 | 0 | 2 | 9 | |
| GSE74703 | AP1G2 | 8906 | 6 | 2 | 28 | |
| GSE74704 | AP1G2 | 8906 | 3 | 1 | 16 | |
| TCGA | AP1G2 | 8906 | 27 | 14 | 55 |
Total number of gains: 108; Total number of losses: 51; Total Number of normals: 329.
Somatic mutations of AP1G2:
Generating mutation plots.
Highly correlated genes for AP1G2:
Showing top 20/509 corelated genes with mean PCC>0.5.
| Gene1 | Gene2 | Mean PCC | Num. Datasets | Num. PCC<0 | Num. PCC>0.5 |
|---|---|---|---|---|---|
| AP1G2 | STON2 | 0.789739 | 3 | 0 | 3 |
| AP1G2 | NEK8 | 0.777789 | 3 | 0 | 3 |
| AP1G2 | GPR160 | 0.77665 | 3 | 0 | 3 |
| AP1G2 | TOM1 | 0.769415 | 3 | 0 | 3 |
| AP1G2 | ZC3H12D | 0.756137 | 3 | 0 | 3 |
| AP1G2 | ARHGAP32 | 0.743572 | 3 | 0 | 3 |
| AP1G2 | MORN3 | 0.739287 | 3 | 0 | 3 |
| AP1G2 | CLCN3 | 0.736812 | 3 | 0 | 3 |
| AP1G2 | NIPAL1 | 0.732646 | 3 | 0 | 3 |
| AP1G2 | SLC25A39 | 0.732259 | 4 | 0 | 3 |
| AP1G2 | DCXR | 0.728076 | 3 | 0 | 3 |
| AP1G2 | ANKRD18B | 0.727748 | 3 | 0 | 3 |
| AP1G2 | SYTL1 | 0.727664 | 5 | 0 | 5 |
| AP1G2 | NUAK2 | 0.727514 | 3 | 0 | 3 |
| AP1G2 | RAB25 | 0.726565 | 5 | 0 | 5 |
| AP1G2 | EPHA1 | 0.72447 | 4 | 0 | 3 |
| AP1G2 | CAPN14 | 0.7202 | 3 | 0 | 3 |
| AP1G2 | LTA4H | 0.718702 | 3 | 0 | 3 |
| AP1G2 | UHRF2 | 0.717744 | 3 | 0 | 3 |
| AP1G2 | LACTBL1 | 0.716614 | 3 | 0 | 3 |
For details and further investigation, click here


