| Full name: amyloid beta precursor protein binding family A member 3 | Alias Symbol: X11L2|mint3 | ||
| Type: protein-coding gene | Cytoband: 19p13.3 | ||
| Entrez ID: 9546 | HGNC ID: HGNC:580 | Ensembl Gene: | OMIM ID: 604262 |
Expression of APBA3:
| Dataset | Gene | EntrezID | Probe | Log2FC | Adj.pValue | Expression |
|---|---|---|---|---|---|---|
| GSE17351 | APBA3 | 9546 | 215148_s_at | 0.3930 | 0.3136 | |
| GSE20347 | APBA3 | 9546 | 215148_s_at | 0.4115 | 0.0042 | |
| GSE23400 | APBA3 | 9546 | 215148_s_at | 0.2823 | 0.0000 | |
| GSE26886 | APBA3 | 9546 | 215148_s_at | 1.3050 | 0.0000 | |
| GSE29001 | APBA3 | 9546 | 215148_s_at | 0.3032 | 0.4393 | |
| GSE38129 | APBA3 | 9546 | 215148_s_at | 0.3993 | 0.0002 | |
| GSE45670 | APBA3 | 9546 | 215148_s_at | 0.4708 | 0.0004 | |
| GSE53622 | APBA3 | 9546 | 4408 | 0.2554 | 0.0001 | |
| GSE53624 | APBA3 | 9546 | 4408 | 0.3297 | 0.0000 | |
| GSE63941 | APBA3 | 9546 | 215148_s_at | -0.2291 | 0.6256 | |
| GSE77861 | APBA3 | 9546 | 215148_s_at | 0.3302 | 0.1012 | |
| GSE97050 | APBA3 | 9546 | A_33_P3295640 | 0.1125 | 0.6606 | |
| SRP007169 | APBA3 | 9546 | RNAseq | -0.9240 | 0.0150 | |
| SRP008496 | APBA3 | 9546 | RNAseq | -0.3801 | 0.1914 | |
| SRP064894 | APBA3 | 9546 | RNAseq | 0.4888 | 0.0316 | |
| SRP133303 | APBA3 | 9546 | RNAseq | 0.2974 | 0.1303 | |
| SRP159526 | APBA3 | 9546 | RNAseq | 0.0455 | 0.8506 | |
| SRP193095 | APBA3 | 9546 | RNAseq | 0.2316 | 0.0228 | |
| SRP219564 | APBA3 | 9546 | RNAseq | 0.2765 | 0.2220 | |
| TCGA | APBA3 | 9546 | RNAseq | 0.0586 | 0.3267 |
Upregulated datasets: 1; Downregulated datasets: 0.
Survival by APBA3 expression:
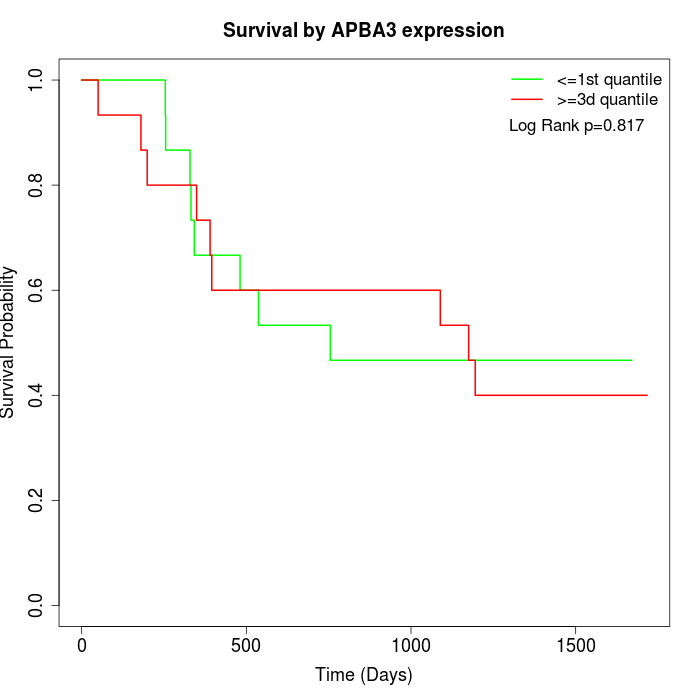 | 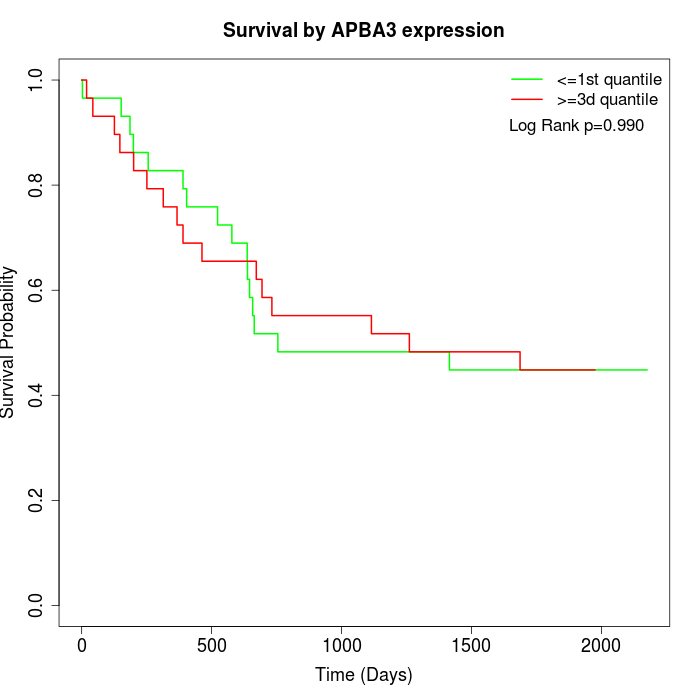 | 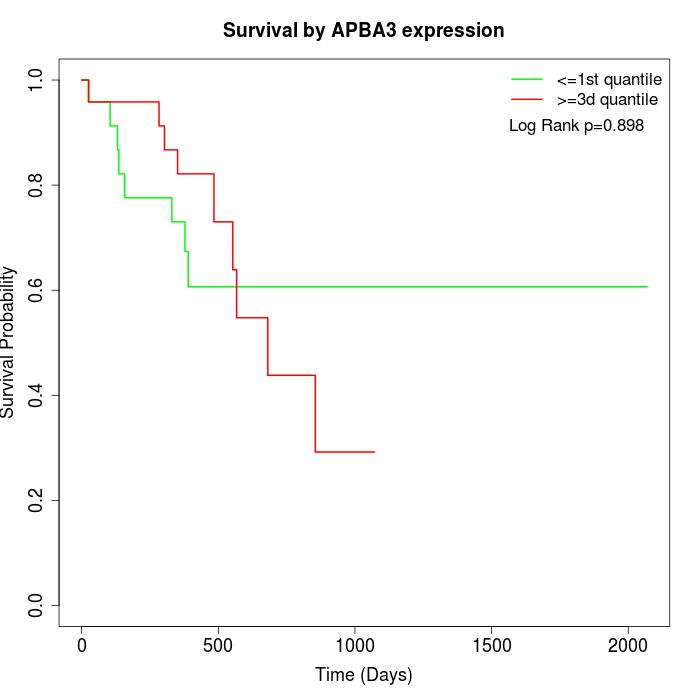 |
| GSE53622 | GSE53624 | TCGA |
Note: Click image to view full size file.
Copy number change of APBA3:
| Dataset | Gene | EntrezID | Gain | Loss | Normal | Detail |
|---|---|---|---|---|---|---|
| GSE15526 | APBA3 | 9546 | 5 | 3 | 22 | |
| GSE20123 | APBA3 | 9546 | 4 | 2 | 24 | |
| GSE43470 | APBA3 | 9546 | 1 | 9 | 33 | |
| GSE46452 | APBA3 | 9546 | 47 | 1 | 11 | |
| GSE47630 | APBA3 | 9546 | 5 | 7 | 28 | |
| GSE54993 | APBA3 | 9546 | 16 | 3 | 51 | |
| GSE54994 | APBA3 | 9546 | 8 | 16 | 29 | |
| GSE60625 | APBA3 | 9546 | 9 | 0 | 2 | |
| GSE74703 | APBA3 | 9546 | 1 | 6 | 29 | |
| GSE74704 | APBA3 | 9546 | 1 | 2 | 17 | |
| TCGA | APBA3 | 9546 | 10 | 19 | 67 |
Total number of gains: 107; Total number of losses: 68; Total Number of normals: 313.
Somatic mutations of APBA3:
Generating mutation plots.
Highly correlated genes for APBA3:
Showing top 20/645 corelated genes with mean PCC>0.5.
| Gene1 | Gene2 | Mean PCC | Num. Datasets | Num. PCC<0 | Num. PCC>0.5 |
|---|---|---|---|---|---|
| APBA3 | IRX2 | 0.743701 | 4 | 0 | 4 |
| APBA3 | SLC39A3 | 0.717338 | 3 | 0 | 3 |
| APBA3 | CD276 | 0.700431 | 3 | 0 | 3 |
| APBA3 | EME1 | 0.696949 | 3 | 0 | 3 |
| APBA3 | IGSF9 | 0.694899 | 4 | 0 | 4 |
| APBA3 | DPH7 | 0.693922 | 4 | 0 | 4 |
| APBA3 | SERPINF2 | 0.69309 | 3 | 0 | 3 |
| APBA3 | FRMD6-AS1 | 0.687532 | 3 | 0 | 3 |
| APBA3 | ODF3L1 | 0.685781 | 3 | 0 | 3 |
| APBA3 | ZNF558 | 0.68467 | 3 | 0 | 3 |
| APBA3 | POU6F2-AS2 | 0.684036 | 3 | 0 | 3 |
| APBA3 | EEF1D | 0.679458 | 5 | 0 | 5 |
| APBA3 | SRRT | 0.671697 | 8 | 0 | 7 |
| APBA3 | ACVR2B | 0.669742 | 4 | 0 | 4 |
| APBA3 | ZNF574 | 0.669706 | 3 | 0 | 3 |
| APBA3 | NUP210 | 0.668329 | 5 | 0 | 5 |
| APBA3 | HSF1 | 0.665589 | 6 | 0 | 5 |
| APBA3 | GOLM1 | 0.660333 | 4 | 0 | 4 |
| APBA3 | LRRC69 | 0.657142 | 4 | 0 | 4 |
| APBA3 | GNB1L | 0.656692 | 3 | 0 | 3 |
For details and further investigation, click here