| Full name: Bardet-Biedl syndrome 10 | Alias Symbol: FLJ23560 | ||
| Type: protein-coding gene | Cytoband: 12q21.2 | ||
| Entrez ID: 79738 | HGNC ID: HGNC:26291 | Ensembl Gene: ENSG00000179941 | OMIM ID: 610148 |
Expression of BBS10:
| Dataset | Gene | EntrezID | Probe | Log2FC | Adj.pValue | Expression |
|---|---|---|---|---|---|---|
| GSE17351 | BBS10 | 79738 | 219487_at | -0.1005 | 0.8405 | |
| GSE20347 | BBS10 | 79738 | 219487_at | 0.0199 | 0.8900 | |
| GSE23400 | BBS10 | 79738 | 219487_at | 0.0916 | 0.0671 | |
| GSE26886 | BBS10 | 79738 | 219487_at | 0.7307 | 0.0005 | |
| GSE29001 | BBS10 | 79738 | 219487_at | 0.1026 | 0.8215 | |
| GSE38129 | BBS10 | 79738 | 219487_at | 0.0126 | 0.9178 | |
| GSE45670 | BBS10 | 79738 | 219487_at | 0.1732 | 0.2628 | |
| GSE53622 | BBS10 | 79738 | 35862 | 0.1181 | 0.2016 | |
| GSE53624 | BBS10 | 79738 | 35862 | 0.1748 | 0.0607 | |
| GSE63941 | BBS10 | 79738 | 219487_at | -0.7911 | 0.0275 | |
| GSE77861 | BBS10 | 79738 | 219487_at | 0.3193 | 0.2790 | |
| GSE97050 | BBS10 | 79738 | A_24_P181149 | -0.0890 | 0.6644 | |
| SRP007169 | BBS10 | 79738 | RNAseq | 0.3679 | 0.3428 | |
| SRP008496 | BBS10 | 79738 | RNAseq | 0.5932 | 0.0237 | |
| SRP064894 | BBS10 | 79738 | RNAseq | 0.1341 | 0.5803 | |
| SRP133303 | BBS10 | 79738 | RNAseq | 0.1883 | 0.2010 | |
| SRP159526 | BBS10 | 79738 | RNAseq | 0.1638 | 0.4828 | |
| SRP193095 | BBS10 | 79738 | RNAseq | -0.0230 | 0.8568 | |
| SRP219564 | BBS10 | 79738 | RNAseq | -0.1253 | 0.5989 | |
| TCGA | BBS10 | 79738 | RNAseq | 0.0511 | 0.3988 |
Upregulated datasets: 0; Downregulated datasets: 0.
Survival by BBS10 expression:
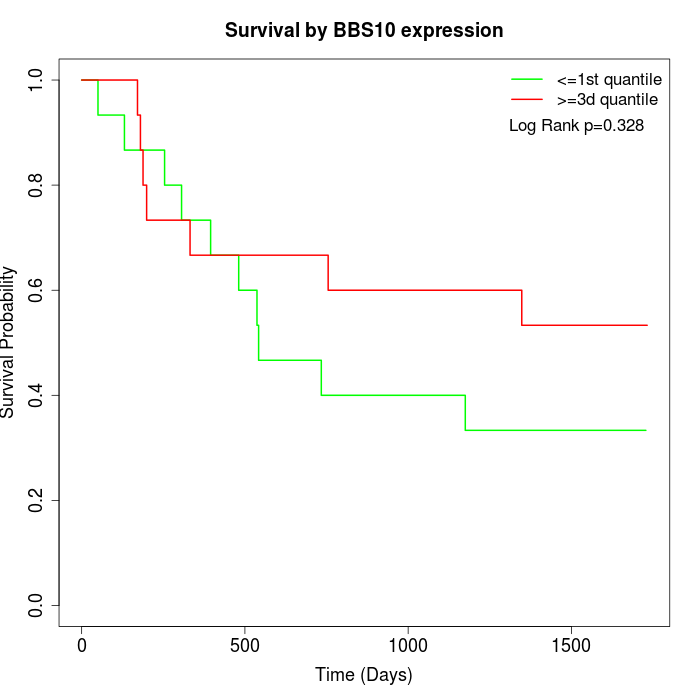 | 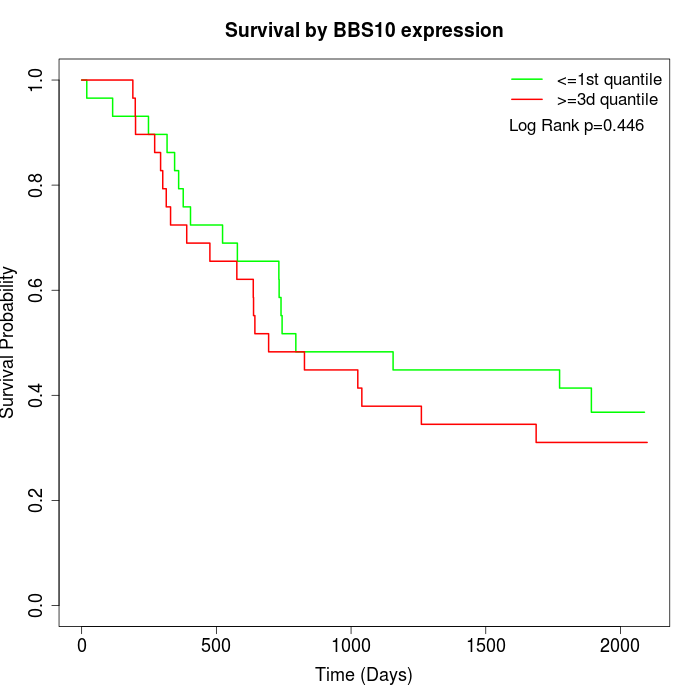 | 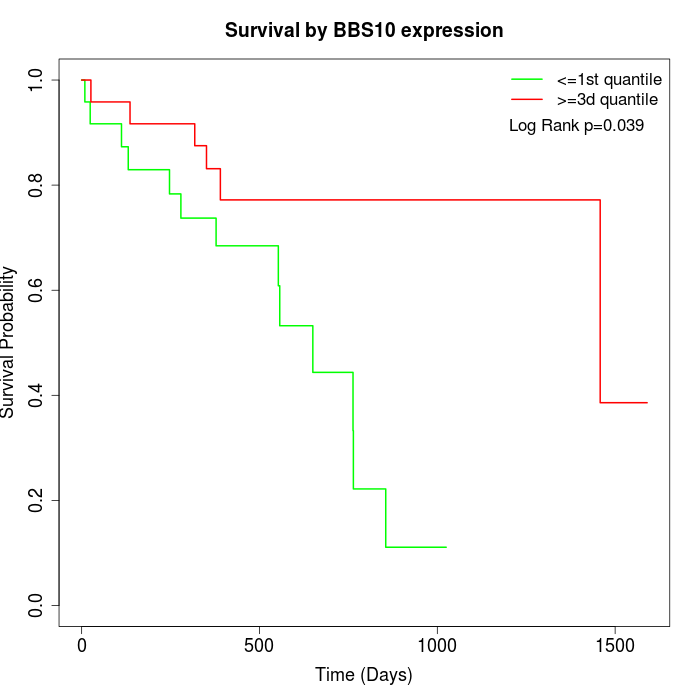 |
| GSE53622 | GSE53624 | TCGA |
Note: Click image to view full size file.
Copy number change of BBS10:
| Dataset | Gene | EntrezID | Gain | Loss | Normal | Detail |
|---|---|---|---|---|---|---|
| GSE15526 | BBS10 | 79738 | 3 | 3 | 24 | |
| GSE20123 | BBS10 | 79738 | 3 | 3 | 24 | |
| GSE43470 | BBS10 | 79738 | 3 | 1 | 39 | |
| GSE46452 | BBS10 | 79738 | 8 | 1 | 50 | |
| GSE47630 | BBS10 | 79738 | 10 | 1 | 29 | |
| GSE54993 | BBS10 | 79738 | 0 | 5 | 65 | |
| GSE54994 | BBS10 | 79738 | 5 | 2 | 46 | |
| GSE60625 | BBS10 | 79738 | 0 | 0 | 11 | |
| GSE74703 | BBS10 | 79738 | 3 | 1 | 32 | |
| GSE74704 | BBS10 | 79738 | 2 | 2 | 16 | |
| TCGA | BBS10 | 79738 | 14 | 15 | 67 |
Total number of gains: 51; Total number of losses: 34; Total Number of normals: 403.
Somatic mutations of BBS10:
Generating mutation plots.
Highly correlated genes for BBS10:
Showing top 20/171 corelated genes with mean PCC>0.5.
| Gene1 | Gene2 | Mean PCC | Num. Datasets | Num. PCC<0 | Num. PCC>0.5 |
|---|---|---|---|---|---|
| BBS10 | CD44 | 0.671181 | 3 | 0 | 3 |
| BBS10 | DMTF1 | 0.667145 | 4 | 0 | 3 |
| BBS10 | KMT2E | 0.659702 | 3 | 0 | 3 |
| BBS10 | PGAP1 | 0.658677 | 3 | 0 | 3 |
| BBS10 | MTERF2 | 0.656692 | 3 | 0 | 3 |
| BBS10 | LINC00674 | 0.646904 | 4 | 0 | 3 |
| BBS10 | ZNF827 | 0.642698 | 3 | 0 | 3 |
| BBS10 | MTERF3 | 0.639825 | 3 | 0 | 3 |
| BBS10 | PEX12 | 0.638223 | 5 | 0 | 5 |
| BBS10 | ELF2 | 0.632349 | 3 | 0 | 3 |
| BBS10 | SCAI | 0.631292 | 6 | 0 | 5 |
| BBS10 | FMR1 | 0.626958 | 6 | 0 | 5 |
| BBS10 | RICTOR | 0.620328 | 3 | 0 | 3 |
| BBS10 | EOGT | 0.61902 | 4 | 0 | 3 |
| BBS10 | CSNK1G3 | 0.602895 | 5 | 0 | 4 |
| BBS10 | TAF7 | 0.592176 | 5 | 0 | 4 |
| BBS10 | DMXL2 | 0.590178 | 4 | 0 | 3 |
| BBS10 | PTAR1 | 0.588539 | 4 | 0 | 3 |
| BBS10 | TIMM17A | 0.587241 | 3 | 0 | 3 |
| BBS10 | AKAP11 | 0.586996 | 4 | 0 | 3 |
For details and further investigation, click here