| Full name: BCL2 interacting protein 3 | Alias Symbol: Nip3 | ||
| Type: protein-coding gene | Cytoband: 10q26.3 | ||
| Entrez ID: 664 | HGNC ID: HGNC:1084 | Ensembl Gene: ENSG00000176171 | OMIM ID: 603293 |
Screen Evidence:
| |||
BNIP3 involved pathways:
| KEGG pathway | Description | View |
|---|---|---|
| hsa04068 | FoxO signaling pathway |
Expression of BNIP3:
| Dataset | Gene | EntrezID | Probe | Log2FC | Adj.pValue | Expression |
|---|---|---|---|---|---|---|
| GSE17351 | BNIP3 | 664 | 201849_at | -1.0560 | 0.4429 | |
| GSE20347 | BNIP3 | 664 | 201849_at | -0.6400 | 0.0672 | |
| GSE23400 | BNIP3 | 664 | 201849_at | -0.2827 | 0.1071 | |
| GSE26886 | BNIP3 | 664 | 201849_at | -1.2021 | 0.0002 | |
| GSE29001 | BNIP3 | 664 | 201849_at | -0.4932 | 0.2912 | |
| GSE38129 | BNIP3 | 664 | 201849_at | -0.4500 | 0.1017 | |
| GSE45670 | BNIP3 | 664 | 201849_at | -0.3027 | 0.4226 | |
| GSE53622 | BNIP3 | 664 | 79023 | 0.0028 | 0.9871 | |
| GSE53624 | BNIP3 | 664 | 79023 | -0.2031 | 0.0389 | |
| GSE63941 | BNIP3 | 664 | 201849_at | -1.3597 | 0.2315 | |
| GSE77861 | BNIP3 | 664 | 201849_at | -1.0871 | 0.1319 | |
| GSE97050 | BNIP3 | 664 | A_33_P3419785 | 0.2555 | 0.4939 | |
| SRP007169 | BNIP3 | 664 | RNAseq | -2.0354 | 0.0000 | |
| SRP008496 | BNIP3 | 664 | RNAseq | -1.5171 | 0.0001 | |
| SRP064894 | BNIP3 | 664 | RNAseq | -0.8912 | 0.0008 | |
| SRP133303 | BNIP3 | 664 | RNAseq | 0.2187 | 0.5830 | |
| SRP159526 | BNIP3 | 664 | RNAseq | -0.3844 | 0.4229 | |
| SRP193095 | BNIP3 | 664 | RNAseq | -0.6336 | 0.0463 | |
| SRP219564 | BNIP3 | 664 | RNAseq | -0.7597 | 0.1559 | |
| TCGA | BNIP3 | 664 | RNAseq | 0.0466 | 0.6711 |
Upregulated datasets: 0; Downregulated datasets: 3.
Survival by BNIP3 expression:
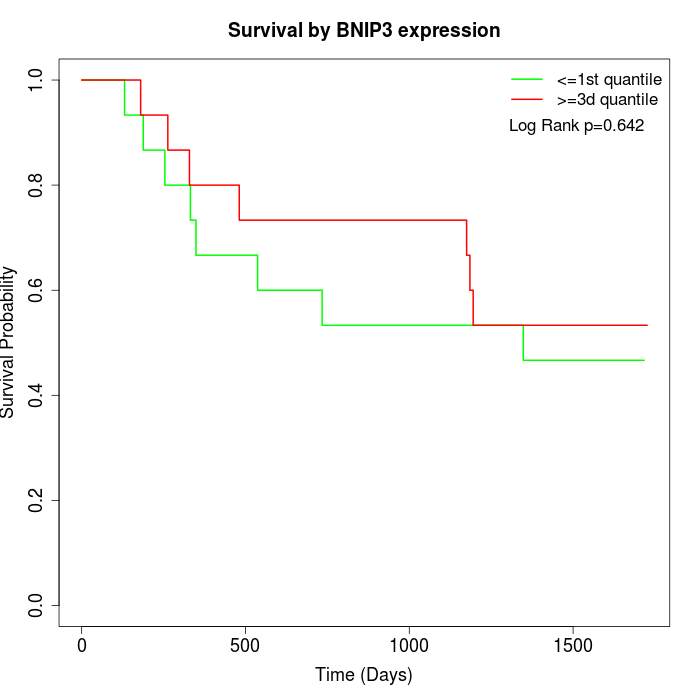 | 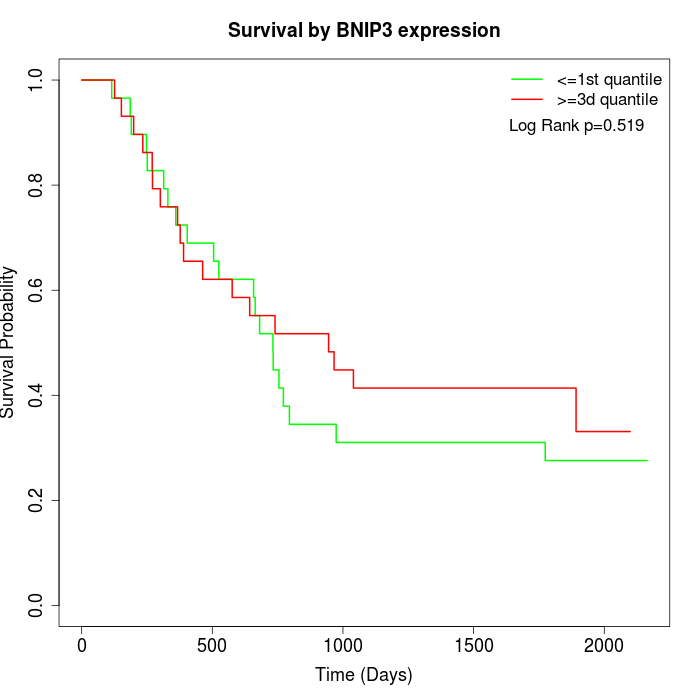 | 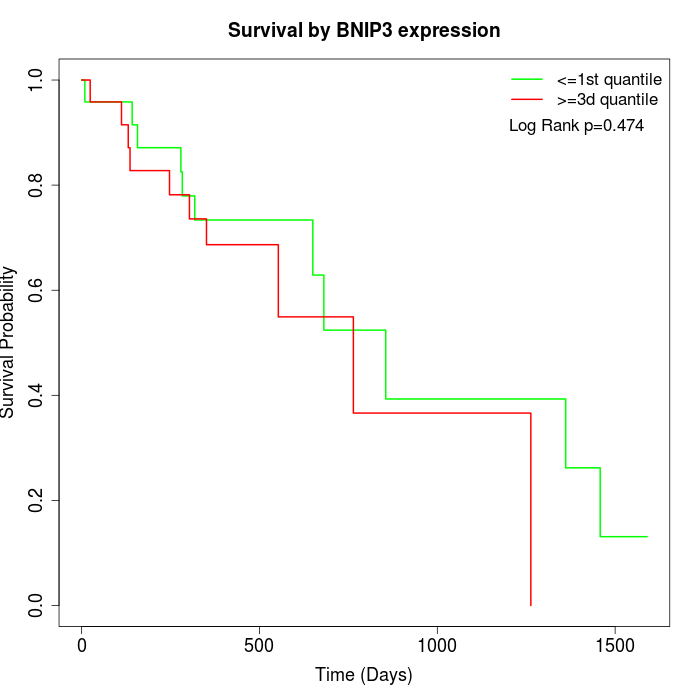 |
| GSE53622 | GSE53624 | TCGA |
Note: Click image to view full size file.
Copy number change of BNIP3:
| Dataset | Gene | EntrezID | Gain | Loss | Normal | Detail |
|---|---|---|---|---|---|---|
| GSE15526 | BNIP3 | 664 | 2 | 9 | 19 | |
| GSE20123 | BNIP3 | 664 | 2 | 9 | 19 | |
| GSE43470 | BNIP3 | 664 | 0 | 10 | 33 | |
| GSE46452 | BNIP3 | 664 | 1 | 11 | 47 | |
| GSE47630 | BNIP3 | 664 | 4 | 13 | 23 | |
| GSE54993 | BNIP3 | 664 | 7 | 1 | 62 | |
| GSE54994 | BNIP3 | 664 | 1 | 9 | 43 | |
| GSE60625 | BNIP3 | 664 | 0 | 0 | 11 | |
| GSE74703 | BNIP3 | 664 | 0 | 6 | 30 | |
| GSE74704 | BNIP3 | 664 | 2 | 4 | 14 | |
| TCGA | BNIP3 | 664 | 7 | 28 | 61 |
Total number of gains: 26; Total number of losses: 100; Total Number of normals: 362.
Somatic mutations of BNIP3:
Generating mutation plots.
Highly correlated genes for BNIP3:
Showing top 20/439 corelated genes with mean PCC>0.5.
| Gene1 | Gene2 | Mean PCC | Num. Datasets | Num. PCC<0 | Num. PCC>0.5 |
|---|---|---|---|---|---|
| BNIP3 | CEPT1 | 0.768269 | 3 | 0 | 3 |
| BNIP3 | UTY | 0.749313 | 3 | 0 | 3 |
| BNIP3 | MLKL | 0.740149 | 3 | 0 | 3 |
| BNIP3 | BDP1 | 0.735087 | 3 | 0 | 3 |
| BNIP3 | CHMP2A | 0.730167 | 3 | 0 | 3 |
| BNIP3 | LACTB | 0.723673 | 3 | 0 | 3 |
| BNIP3 | C1GALT1C1 | 0.718951 | 3 | 0 | 3 |
| BNIP3 | GRAP2 | 0.714135 | 3 | 0 | 3 |
| BNIP3 | ALAS1 | 0.712736 | 3 | 0 | 3 |
| BNIP3 | STEAP4 | 0.711021 | 3 | 0 | 3 |
| BNIP3 | DAD1 | 0.710368 | 3 | 0 | 3 |
| BNIP3 | SRD5A1 | 0.708814 | 3 | 0 | 3 |
| BNIP3 | ZNF416 | 0.708706 | 3 | 0 | 3 |
| BNIP3 | ZFC3H1 | 0.706263 | 3 | 0 | 3 |
| BNIP3 | GPCPD1 | 0.703801 | 3 | 0 | 3 |
| BNIP3 | RPS4Y1 | 0.699548 | 3 | 0 | 3 |
| BNIP3 | RPS23 | 0.698298 | 3 | 0 | 3 |
| BNIP3 | WDFY1 | 0.694616 | 3 | 0 | 3 |
| BNIP3 | BRWD3 | 0.681431 | 4 | 0 | 4 |
| BNIP3 | TMEM59 | 0.678257 | 4 | 0 | 4 |
For details and further investigation, click here