| Full name: choline/ethanolamine phosphotransferase 1 | Alias Symbol: | ||
| Type: protein-coding gene | Cytoband: 1p13.3 | ||
| Entrez ID: 10390 | HGNC ID: HGNC:24289 | Ensembl Gene: ENSG00000134255 | OMIM ID: 616751 |
Screen Evidence:
| |||
Expression of CEPT1:
| Dataset | Gene | EntrezID | Probe | Log2FC | Adj.pValue | Expression |
|---|---|---|---|---|---|---|
| GSE17351 | CEPT1 | 10390 | 219375_at | -0.2177 | 0.6068 | |
| GSE20347 | CEPT1 | 10390 | 219375_at | -0.3612 | 0.0055 | |
| GSE23400 | CEPT1 | 10390 | 219375_at | -0.0034 | 0.9649 | |
| GSE26886 | CEPT1 | 10390 | 219375_at | -1.9056 | 0.0000 | |
| GSE29001 | CEPT1 | 10390 | 219375_at | -0.1310 | 0.5887 | |
| GSE38129 | CEPT1 | 10390 | 219375_at | -0.2308 | 0.1320 | |
| GSE45670 | CEPT1 | 10390 | 219375_at | -0.0797 | 0.5863 | |
| GSE53622 | CEPT1 | 10390 | 34559 | -0.3201 | 0.0000 | |
| GSE53624 | CEPT1 | 10390 | 34559 | -0.3755 | 0.0000 | |
| GSE63941 | CEPT1 | 10390 | 219375_at | -0.9894 | 0.0202 | |
| GSE77861 | CEPT1 | 10390 | 219375_at | -0.4081 | 0.0192 | |
| GSE97050 | CEPT1 | 10390 | A_24_P233944 | 0.4164 | 0.2232 | |
| SRP007169 | CEPT1 | 10390 | RNAseq | -0.1415 | 0.7372 | |
| SRP008496 | CEPT1 | 10390 | RNAseq | -0.4209 | 0.0955 | |
| SRP064894 | CEPT1 | 10390 | RNAseq | 0.0366 | 0.8211 | |
| SRP133303 | CEPT1 | 10390 | RNAseq | -0.2500 | 0.0864 | |
| SRP159526 | CEPT1 | 10390 | RNAseq | -0.8155 | 0.0027 | |
| SRP193095 | CEPT1 | 10390 | RNAseq | -0.6126 | 0.0000 | |
| SRP219564 | CEPT1 | 10390 | RNAseq | -0.0418 | 0.9009 | |
| TCGA | CEPT1 | 10390 | RNAseq | -0.0889 | 0.0934 |
Upregulated datasets: 0; Downregulated datasets: 1.
Survival by CEPT1 expression:
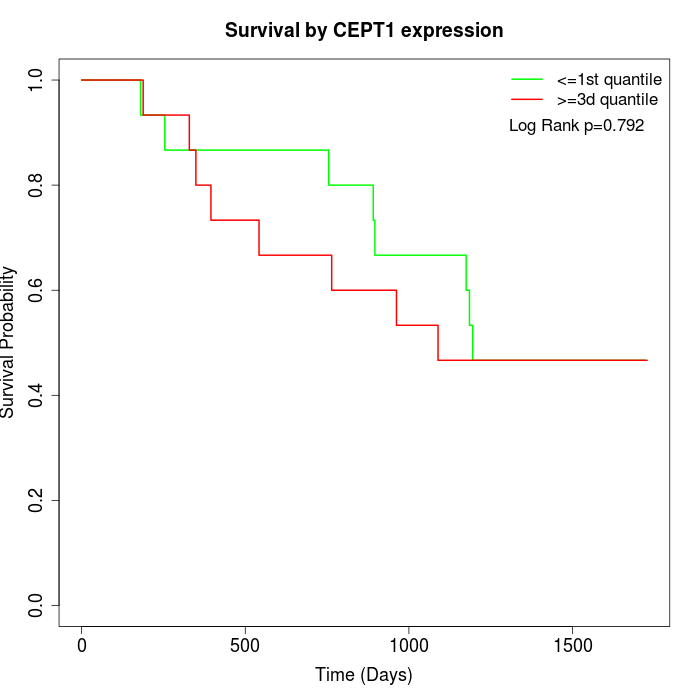 | 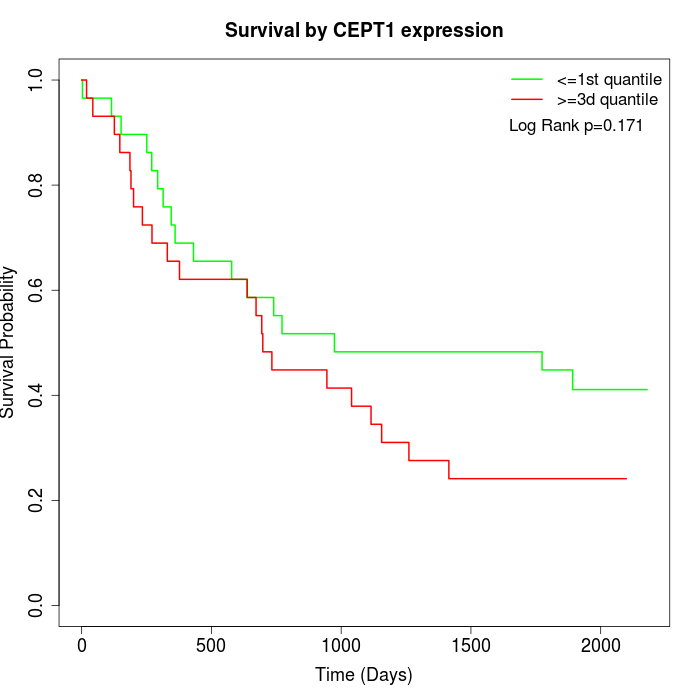 | 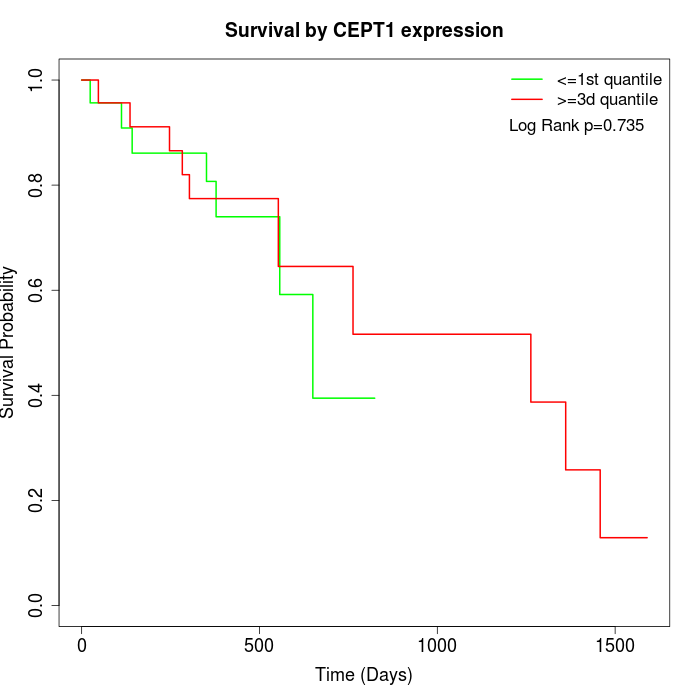 |
| GSE53622 | GSE53624 | TCGA |
Note: Click image to view full size file.
Copy number change of CEPT1:
| Dataset | Gene | EntrezID | Gain | Loss | Normal | Detail |
|---|---|---|---|---|---|---|
| GSE15526 | CEPT1 | 10390 | 0 | 11 | 19 | |
| GSE20123 | CEPT1 | 10390 | 0 | 11 | 19 | |
| GSE43470 | CEPT1 | 10390 | 0 | 8 | 35 | |
| GSE46452 | CEPT1 | 10390 | 2 | 1 | 56 | |
| GSE47630 | CEPT1 | 10390 | 9 | 5 | 26 | |
| GSE54993 | CEPT1 | 10390 | 0 | 1 | 69 | |
| GSE54994 | CEPT1 | 10390 | 7 | 4 | 42 | |
| GSE60625 | CEPT1 | 10390 | 0 | 0 | 11 | |
| GSE74703 | CEPT1 | 10390 | 0 | 7 | 29 | |
| GSE74704 | CEPT1 | 10390 | 0 | 7 | 13 | |
| TCGA | CEPT1 | 10390 | 7 | 27 | 62 |
Total number of gains: 25; Total number of losses: 82; Total Number of normals: 381.
Somatic mutations of CEPT1:
Generating mutation plots.
Highly correlated genes for CEPT1:
Showing top 20/919 corelated genes with mean PCC>0.5.
| Gene1 | Gene2 | Mean PCC | Num. Datasets | Num. PCC<0 | Num. PCC>0.5 |
|---|---|---|---|---|---|
| CEPT1 | AKIRIN2 | 0.800068 | 3 | 0 | 3 |
| CEPT1 | LRRC28 | 0.789165 | 3 | 0 | 3 |
| CEPT1 | PPP4R1 | 0.776833 | 4 | 0 | 4 |
| CEPT1 | BNIP3 | 0.768269 | 3 | 0 | 3 |
| CEPT1 | ZNF92 | 0.757631 | 3 | 0 | 3 |
| CEPT1 | MTMR3 | 0.753624 | 4 | 0 | 4 |
| CEPT1 | UBQLN1 | 0.751849 | 3 | 0 | 3 |
| CEPT1 | RHBDF1 | 0.750767 | 4 | 0 | 3 |
| CEPT1 | ACTR2 | 0.747883 | 4 | 0 | 3 |
| CEPT1 | PORCN | 0.72927 | 3 | 0 | 3 |
| CEPT1 | MTA3 | 0.725016 | 4 | 0 | 3 |
| CEPT1 | TMEM50A | 0.721769 | 4 | 0 | 3 |
| CEPT1 | TRAPPC6B | 0.72153 | 3 | 0 | 3 |
| CEPT1 | SH3PXD2A | 0.714747 | 3 | 0 | 3 |
| CEPT1 | RNFT1 | 0.707596 | 3 | 0 | 3 |
| CEPT1 | SPNS2 | 0.705513 | 3 | 0 | 3 |
| CEPT1 | PHLDA1 | 0.702015 | 6 | 0 | 5 |
| CEPT1 | FAHD1 | 0.701119 | 3 | 0 | 3 |
| CEPT1 | EIF3F | 0.700944 | 4 | 0 | 4 |
| CEPT1 | SNX14 | 0.699161 | 4 | 0 | 4 |
For details and further investigation, click here