| Full name: B-Raf proto-oncogene, serine/threonine kinase | Alias Symbol: BRAF1 | ||
| Type: protein-coding gene | Cytoband: 7q34 | ||
| Entrez ID: 673 | HGNC ID: HGNC:1097 | Ensembl Gene: ENSG00000157764 | OMIM ID: 164757 |
| Related drugs: AEW-541, AFATINIB, ALPELISIB, ARQ-092, ARQ-736, ATEZOLIZUMAB, AZD-6482, BEVACIZUMAB, BGB-283, BI-2536... [more] | |||
Screen Evidence:
| |||
BRAF involved pathways:
Expression of BRAF:
| Dataset | Gene | EntrezID | Probe | Log2FC | Adj.pValue | Expression |
|---|---|---|---|---|---|---|
| GSE17351 | BRAF | 673 | 226391_at | -0.4166 | 0.2807 | |
| GSE26886 | BRAF | 673 | 226391_at | -0.7646 | 0.0081 | |
| GSE45670 | BRAF | 673 | 226391_at | -0.5127 | 0.0012 | |
| GSE53622 | BRAF | 673 | 51767 | -0.5198 | 0.0000 | |
| GSE53624 | BRAF | 673 | 51767 | -0.4615 | 0.0000 | |
| GSE63941 | BRAF | 673 | 226391_at | -0.3282 | 0.4742 | |
| GSE77861 | BRAF | 673 | 226391_at | -0.1087 | 0.6738 | |
| GSE97050 | BRAF | 673 | A_23_P42935 | -0.2491 | 0.3475 | |
| SRP007169 | BRAF | 673 | RNAseq | -0.0709 | 0.8498 | |
| SRP008496 | BRAF | 673 | RNAseq | 0.0058 | 0.9787 | |
| SRP064894 | BRAF | 673 | RNAseq | -0.3632 | 0.0209 | |
| SRP133303 | BRAF | 673 | RNAseq | -0.1212 | 0.2785 | |
| SRP159526 | BRAF | 673 | RNAseq | -0.2537 | 0.3046 | |
| SRP193095 | BRAF | 673 | RNAseq | -0.2946 | 0.0015 | |
| SRP219564 | BRAF | 673 | RNAseq | -0.4107 | 0.2551 | |
| TCGA | BRAF | 673 | RNAseq | -0.0596 | 0.3837 |
Upregulated datasets: 0; Downregulated datasets: 0.
Survival by BRAF expression:
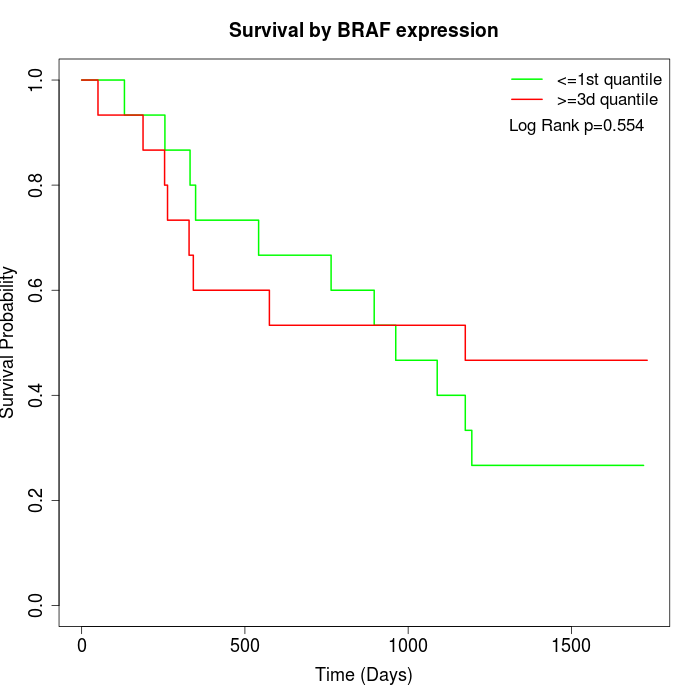 | 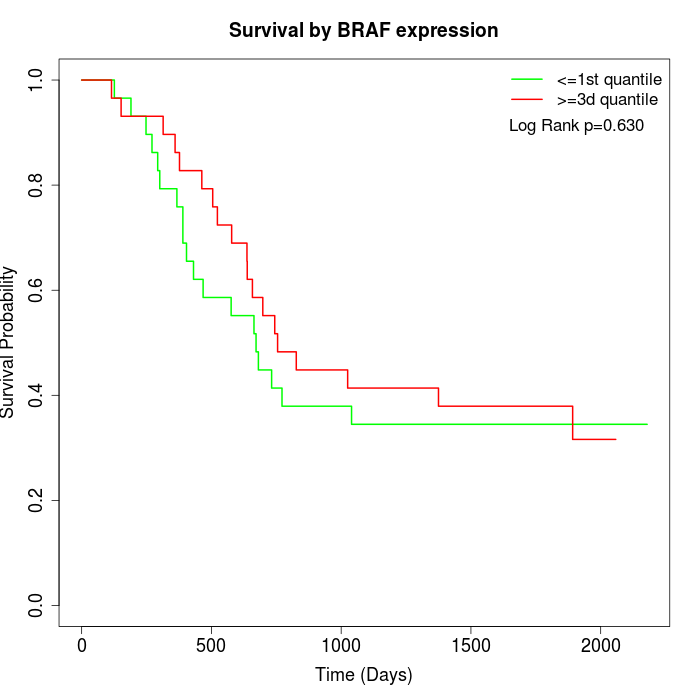 | 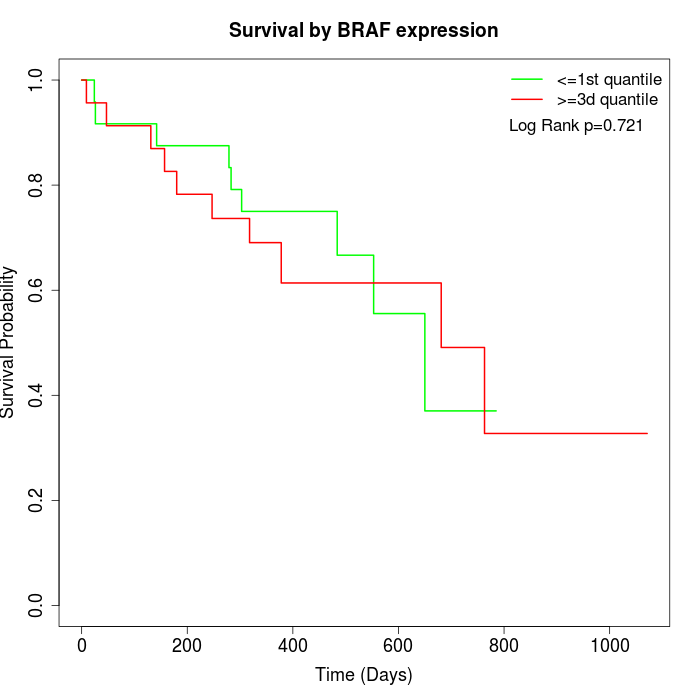 |
| GSE53622 | GSE53624 | TCGA |
Note: Click image to view full size file.
Copy number change of BRAF:
| Dataset | Gene | EntrezID | Gain | Loss | Normal | Detail |
|---|---|---|---|---|---|---|
| GSE15526 | BRAF | 673 | 5 | 2 | 23 | |
| GSE20123 | BRAF | 673 | 5 | 2 | 23 | |
| GSE43470 | BRAF | 673 | 2 | 4 | 37 | |
| GSE46452 | BRAF | 673 | 7 | 2 | 50 | |
| GSE47630 | BRAF | 673 | 7 | 4 | 29 | |
| GSE54993 | BRAF | 673 | 3 | 5 | 62 | |
| GSE54994 | BRAF | 673 | 5 | 8 | 40 | |
| GSE60625 | BRAF | 673 | 0 | 0 | 11 | |
| GSE74703 | BRAF | 673 | 2 | 4 | 30 | |
| GSE74704 | BRAF | 673 | 1 | 2 | 17 | |
| TCGA | BRAF | 673 | 28 | 24 | 44 |
Total number of gains: 65; Total number of losses: 57; Total Number of normals: 366.
Somatic mutations of BRAF:
Generating mutation plots.
Highly correlated genes for BRAF:
Showing top 20/185 corelated genes with mean PCC>0.5.
| Gene1 | Gene2 | Mean PCC | Num. Datasets | Num. PCC<0 | Num. PCC>0.5 |
|---|---|---|---|---|---|
| BRAF | RIPK4 | 0.784675 | 3 | 0 | 3 |
| BRAF | GPR146 | 0.765617 | 3 | 0 | 3 |
| BRAF | CLN3 | 0.761862 | 3 | 0 | 3 |
| BRAF | BCDIN3D | 0.722983 | 3 | 0 | 3 |
| BRAF | GIGYF2 | 0.709027 | 3 | 0 | 3 |
| BRAF | KMT2C | 0.690827 | 5 | 0 | 5 |
| BRAF | CLEC4D | 0.685018 | 3 | 0 | 3 |
| BRAF | WNT2B | 0.679244 | 4 | 0 | 3 |
| BRAF | SEC14L1 | 0.676824 | 4 | 0 | 3 |
| BRAF | ZNF780A | 0.674393 | 4 | 0 | 3 |
| BRAF | RUNDC3B | 0.669628 | 3 | 0 | 3 |
| BRAF | CCSER2 | 0.662753 | 4 | 0 | 4 |
| BRAF | ADAMTS17 | 0.662578 | 4 | 0 | 3 |
| BRAF | EPB41L4A | 0.654469 | 3 | 0 | 3 |
| BRAF | FAM189A2 | 0.653352 | 6 | 0 | 4 |
| BRAF | FAM163B | 0.653343 | 3 | 0 | 3 |
| BRAF | FHIT | 0.652535 | 6 | 0 | 4 |
| BRAF | FGF14 | 0.6516 | 6 | 0 | 4 |
| BRAF | ACKR1 | 0.650093 | 3 | 0 | 3 |
| BRAF | CCDC22 | 0.649529 | 3 | 0 | 3 |
For details and further investigation, click here