| Full name: G protein-coupled receptor 146 | Alias Symbol: PGR8 | ||
| Type: protein-coding gene | Cytoband: 7p22.3 | ||
| Entrez ID: 115330 | HGNC ID: HGNC:21718 | Ensembl Gene: ENSG00000164849 | OMIM ID: |
Expression of GPR146:
| Dataset | Gene | EntrezID | Probe | Log2FC | Adj.pValue | Expression |
|---|---|---|---|---|---|---|
| GSE17351 | GPR146 | 115330 | 228770_at | -0.6486 | 0.0476 | |
| GSE26886 | GPR146 | 115330 | 228770_at | 0.1615 | 0.3424 | |
| GSE45670 | GPR146 | 115330 | 228770_at | -0.4648 | 0.0001 | |
| GSE63941 | GPR146 | 115330 | 228770_at | 0.4799 | 0.2530 | |
| GSE77861 | GPR146 | 115330 | 228770_at | -0.0747 | 0.5726 | |
| GSE97050 | GPR146 | A_21_P0014180 | -0.5381 | 0.1811 | ||
| SRP007169 | GPR146 | 115330 | RNAseq | 0.7835 | 0.3366 | |
| SRP064894 | GPR146 | 115330 | RNAseq | -0.0190 | 0.9556 | |
| SRP133303 | GPR146 | 115330 | RNAseq | -0.4493 | 0.0368 | |
| SRP159526 | GPR146 | 115330 | RNAseq | -0.2000 | 0.6117 | |
| SRP219564 | GPR146 | 115330 | RNAseq | -0.4346 | 0.4070 | |
| TCGA | GPR146 | 115330 | RNAseq | -0.8319 | 0.0000 |
Upregulated datasets: 0; Downregulated datasets: 0.
Survival by GPR146 expression:
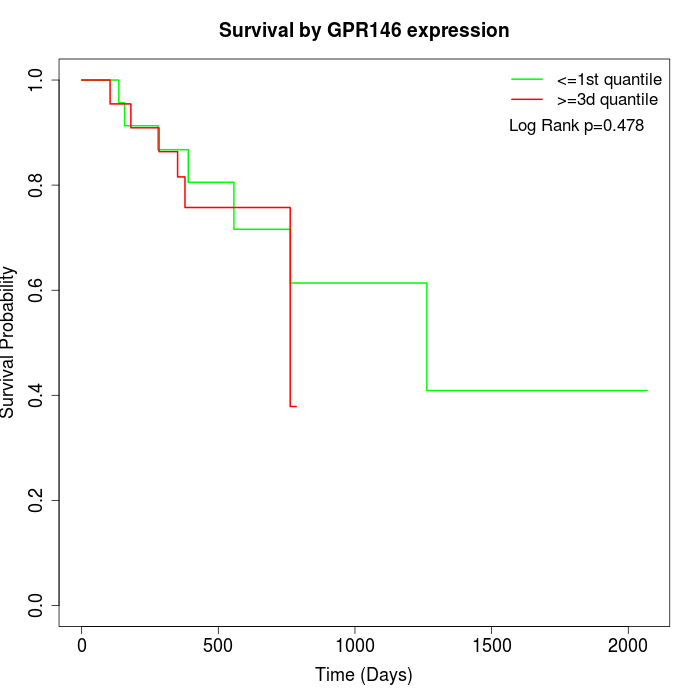 |
| TCGA |
Note: Click image to view full size file.
Copy number change of GPR146:
| Dataset | Gene | EntrezID | Gain | Loss | Normal | Detail |
|---|---|---|---|---|---|---|
| GSE15526 | GPR146 | 115330 | 14 | 0 | 16 | |
| GSE20123 | GPR146 | 115330 | 14 | 0 | 16 | |
| GSE43470 | GPR146 | 115330 | 6 | 2 | 35 | |
| GSE46452 | GPR146 | 115330 | 13 | 1 | 45 | |
| GSE47630 | GPR146 | 115330 | 11 | 1 | 28 | |
| GSE54993 | GPR146 | 115330 | 0 | 7 | 63 | |
| GSE54994 | GPR146 | 115330 | 20 | 2 | 31 | |
| GSE60625 | GPR146 | 115330 | 0 | 0 | 11 | |
| GSE74703 | GPR146 | 115330 | 6 | 1 | 29 | |
| GSE74704 | GPR146 | 115330 | 9 | 0 | 11 | |
| TCGA | GPR146 | 115330 | 56 | 6 | 34 |
Total number of gains: 149; Total number of losses: 20; Total Number of normals: 319.
Somatic mutations of GPR146:
Generating mutation plots.
Highly correlated genes for GPR146:
Showing top 20/102 corelated genes with mean PCC>0.5.
| Gene1 | Gene2 | Mean PCC | Num. Datasets | Num. PCC<0 | Num. PCC>0.5 |
|---|---|---|---|---|---|
| GPR146 | SCARA5 | 0.833845 | 3 | 0 | 3 |
| GPR146 | C16orf89 | 0.818453 | 3 | 0 | 3 |
| GPR146 | LDB2 | 0.815781 | 3 | 0 | 3 |
| GPR146 | GAB2 | 0.805494 | 3 | 0 | 3 |
| GPR146 | PDZRN3 | 0.797687 | 3 | 0 | 3 |
| GPR146 | ITGA10 | 0.796859 | 3 | 0 | 3 |
| GPR146 | BRAF | 0.765617 | 3 | 0 | 3 |
| GPR146 | ZC3H6 | 0.758286 | 3 | 0 | 3 |
| GPR146 | VIPR2 | 0.75341 | 3 | 0 | 3 |
| GPR146 | PHYHIP | 0.749119 | 3 | 0 | 3 |
| GPR146 | KANK3 | 0.746103 | 3 | 0 | 3 |
| GPR146 | VAMP4 | 0.743478 | 3 | 0 | 3 |
| GPR146 | TM6SF1 | 0.738669 | 3 | 0 | 3 |
| GPR146 | PLCXD3 | 0.735991 | 4 | 0 | 4 |
| GPR146 | SCN7A | 0.732103 | 3 | 0 | 3 |
| GPR146 | CTSG | 0.73137 | 3 | 0 | 3 |
| GPR146 | GPR62 | 0.72796 | 3 | 0 | 3 |
| GPR146 | ADRA2A | 0.726835 | 3 | 0 | 3 |
| GPR146 | SEMA3G | 0.719419 | 3 | 0 | 3 |
| GPR146 | GRIN2A | 0.716467 | 3 | 0 | 3 |
For details and further investigation, click here