| Full name: butyrophilin subfamily 3 member A1 | Alias Symbol: BT3.1|BTF5|CD277|BTN3.1 | ||
| Type: protein-coding gene | Cytoband: 6p22.2 | ||
| Entrez ID: 11119 | HGNC ID: HGNC:1138 | Ensembl Gene: ENSG00000026950 | OMIM ID: 613593 |
Expression of BTN3A1:
| Dataset | Gene | EntrezID | Probe | Log2FC | Adj.pValue | Expression |
|---|---|---|---|---|---|---|
| GSE17351 | BTN3A1 | 11119 | 209770_at | 0.4782 | 0.5550 | |
| GSE20347 | BTN3A1 | 11119 | 209770_at | 0.3540 | 0.0844 | |
| GSE23400 | BTN3A1 | 11119 | 209770_at | 0.2024 | 0.0037 | |
| GSE26886 | BTN3A1 | 11119 | 209770_at | 0.6475 | 0.0548 | |
| GSE29001 | BTN3A1 | 11119 | 209770_at | 0.3903 | 0.1177 | |
| GSE38129 | BTN3A1 | 11119 | 209770_at | 0.2014 | 0.2745 | |
| GSE45670 | BTN3A1 | 11119 | 209770_at | 0.4290 | 0.1299 | |
| GSE53622 | BTN3A1 | 11119 | 62955 | 0.3540 | 0.0026 | |
| GSE53624 | BTN3A1 | 11119 | 51871 | 0.4923 | 0.0000 | |
| GSE63941 | BTN3A1 | 11119 | 209770_at | -0.3785 | 0.5817 | |
| GSE77861 | BTN3A1 | 11119 | 209770_at | -0.0068 | 0.9691 | |
| GSE97050 | BTN3A1 | 11119 | A_33_P3388466 | -0.0826 | 0.8389 | |
| SRP007169 | BTN3A1 | 11119 | RNAseq | 1.0305 | 0.0618 | |
| SRP008496 | BTN3A1 | 11119 | RNAseq | 0.8307 | 0.0125 | |
| SRP064894 | BTN3A1 | 11119 | RNAseq | 0.3405 | 0.0827 | |
| SRP133303 | BTN3A1 | 11119 | RNAseq | 0.3667 | 0.0216 | |
| SRP159526 | BTN3A1 | 11119 | RNAseq | 0.1280 | 0.7908 | |
| SRP193095 | BTN3A1 | 11119 | RNAseq | 0.2947 | 0.2116 | |
| SRP219564 | BTN3A1 | 11119 | RNAseq | 1.0563 | 0.0449 | |
| TCGA | BTN3A1 | 11119 | RNAseq | 0.1073 | 0.2993 |
Upregulated datasets: 1; Downregulated datasets: 0.
Survival by BTN3A1 expression:
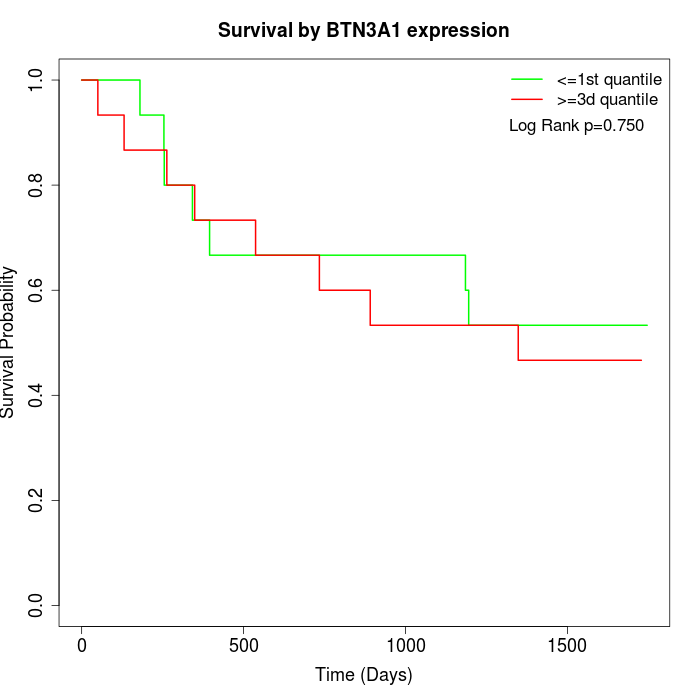 | 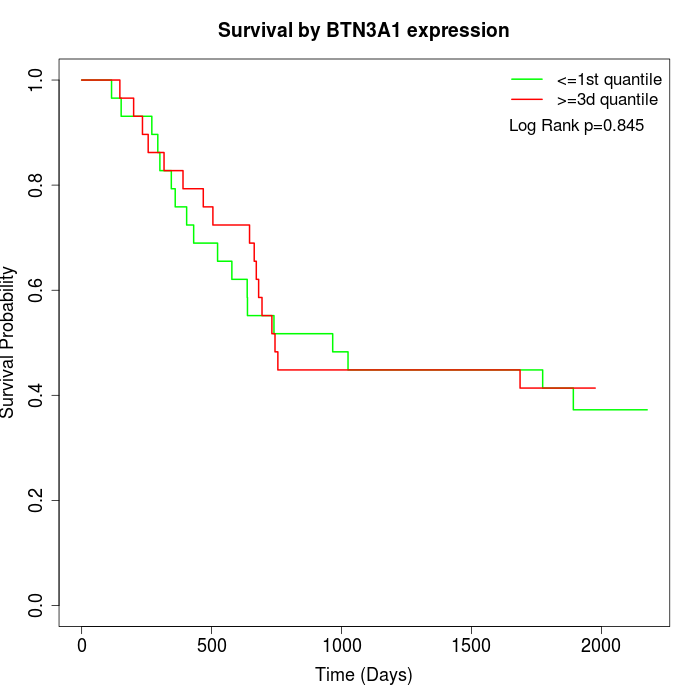 | 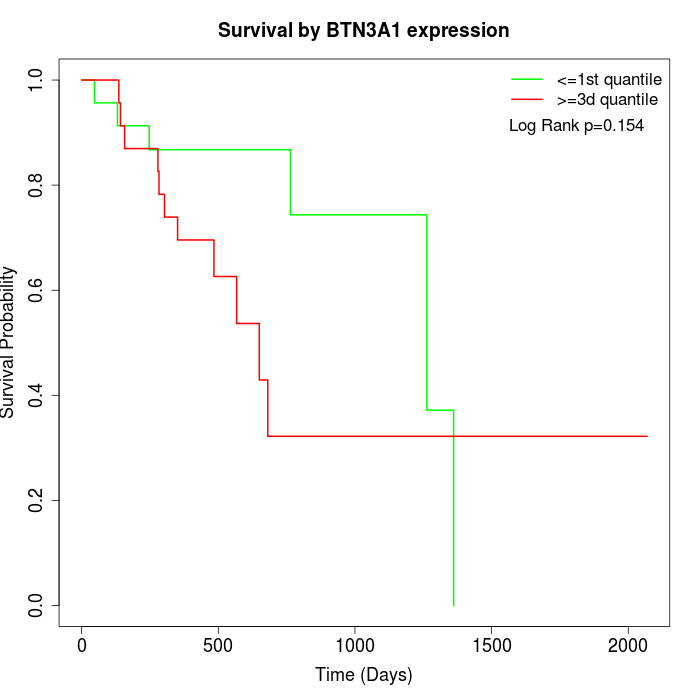 |
| GSE53622 | GSE53624 | TCGA |
Note: Click image to view full size file.
Copy number change of BTN3A1:
| Dataset | Gene | EntrezID | Gain | Loss | Normal | Detail |
|---|---|---|---|---|---|---|
| GSE15526 | BTN3A1 | 11119 | 4 | 2 | 24 | |
| GSE20123 | BTN3A1 | 11119 | 4 | 2 | 24 | |
| GSE43470 | BTN3A1 | 11119 | 5 | 0 | 38 | |
| GSE46452 | BTN3A1 | 11119 | 1 | 9 | 49 | |
| GSE47630 | BTN3A1 | 11119 | 8 | 5 | 27 | |
| GSE54993 | BTN3A1 | 11119 | 1 | 1 | 68 | |
| GSE54994 | BTN3A1 | 11119 | 10 | 4 | 39 | |
| GSE60625 | BTN3A1 | 11119 | 0 | 1 | 10 | |
| GSE74703 | BTN3A1 | 11119 | 5 | 0 | 31 | |
| GSE74704 | BTN3A1 | 11119 | 0 | 1 | 19 | |
| TCGA | BTN3A1 | 11119 | 15 | 21 | 60 |
Total number of gains: 53; Total number of losses: 46; Total Number of normals: 389.
Somatic mutations of BTN3A1:
Generating mutation plots.
Highly correlated genes for BTN3A1:
Showing top 20/452 corelated genes with mean PCC>0.5.
| Gene1 | Gene2 | Mean PCC | Num. Datasets | Num. PCC<0 | Num. PCC>0.5 |
|---|---|---|---|---|---|
| BTN3A1 | BTN3A3 | 0.755526 | 10 | 0 | 9 |
| BTN3A1 | USF2 | 0.716099 | 3 | 0 | 3 |
| BTN3A1 | CD163L1 | 0.713103 | 3 | 0 | 3 |
| BTN3A1 | BTN3A2 | 0.712959 | 13 | 0 | 11 |
| BTN3A1 | HLA-F | 0.71147 | 12 | 0 | 10 |
| BTN3A1 | PSMB8-AS1 | 0.691405 | 6 | 0 | 5 |
| BTN3A1 | NPFF | 0.683837 | 3 | 0 | 3 |
| BTN3A1 | GIMAP5 | 0.68272 | 3 | 0 | 3 |
| BTN3A1 | APOBEC3G | 0.680814 | 8 | 0 | 8 |
| BTN3A1 | HNRNPUL1 | 0.678441 | 4 | 0 | 4 |
| BTN3A1 | TFEC | 0.676314 | 7 | 0 | 7 |
| BTN3A1 | STAT2 | 0.675187 | 7 | 0 | 6 |
| BTN3A1 | HLA-A | 0.674755 | 12 | 0 | 10 |
| BTN3A1 | PSMB9 | 0.673377 | 12 | 0 | 10 |
| BTN3A1 | ASB2 | 0.666207 | 3 | 0 | 3 |
| BTN3A1 | TAP1 | 0.661475 | 11 | 0 | 9 |
| BTN3A1 | FBXO6 | 0.658904 | 6 | 0 | 6 |
| BTN3A1 | CCDC97 | 0.658752 | 4 | 0 | 3 |
| BTN3A1 | FUNDC2 | 0.658191 | 3 | 0 | 3 |
| BTN3A1 | EPSTI1 | 0.657817 | 7 | 0 | 5 |
For details and further investigation, click here