| Full name: signal transducer and activator of transcription 2 | Alias Symbol: STAT113 | ||
| Type: protein-coding gene | Cytoband: 12q13.2 | ||
| Entrez ID: 6773 | HGNC ID: HGNC:11363 | Ensembl Gene: ENSG00000170581 | OMIM ID: 600556 |
| Related drugs: ISOTRETINOIN... [more] | |||
STAT2 involved pathways:
Expression of STAT2:
| Dataset | Gene | EntrezID | Probe | Log2FC | Adj.pValue | Expression |
|---|---|---|---|---|---|---|
| GSE17351 | STAT2 | 6773 | 225636_at | 0.4481 | 0.4392 | |
| GSE20347 | STAT2 | 6773 | 217199_s_at | 0.0727 | 0.3227 | |
| GSE23400 | STAT2 | 6773 | 205170_at | 0.2193 | 0.0006 | |
| GSE26886 | STAT2 | 6773 | 225636_at | 1.2483 | 0.0001 | |
| GSE29001 | STAT2 | 6773 | 217199_s_at | -0.2407 | 0.1486 | |
| GSE38129 | STAT2 | 6773 | 217199_s_at | 0.0624 | 0.4414 | |
| GSE45670 | STAT2 | 6773 | 225636_at | 0.9251 | 0.0001 | |
| GSE63941 | STAT2 | 6773 | 225636_at | -1.6001 | 0.0056 | |
| GSE77861 | STAT2 | 6773 | 225636_at | 0.4757 | 0.0488 | |
| GSE97050 | STAT2 | 6773 | A_33_P3213064 | 0.6417 | 0.1590 | |
| SRP007169 | STAT2 | 6773 | RNAseq | 0.7572 | 0.0247 | |
| SRP008496 | STAT2 | 6773 | RNAseq | 0.7546 | 0.0021 | |
| SRP064894 | STAT2 | 6773 | RNAseq | 1.3620 | 0.0000 | |
| SRP133303 | STAT2 | 6773 | RNAseq | 0.7530 | 0.0000 | |
| SRP159526 | STAT2 | 6773 | RNAseq | 0.1560 | 0.6622 | |
| SRP193095 | STAT2 | 6773 | RNAseq | 0.6738 | 0.0000 | |
| SRP219564 | STAT2 | 6773 | RNAseq | 0.9756 | 0.0282 | |
| TCGA | STAT2 | 6773 | RNAseq | 0.2145 | 0.0001 |
Upregulated datasets: 2; Downregulated datasets: 1.
Survival by STAT2 expression:
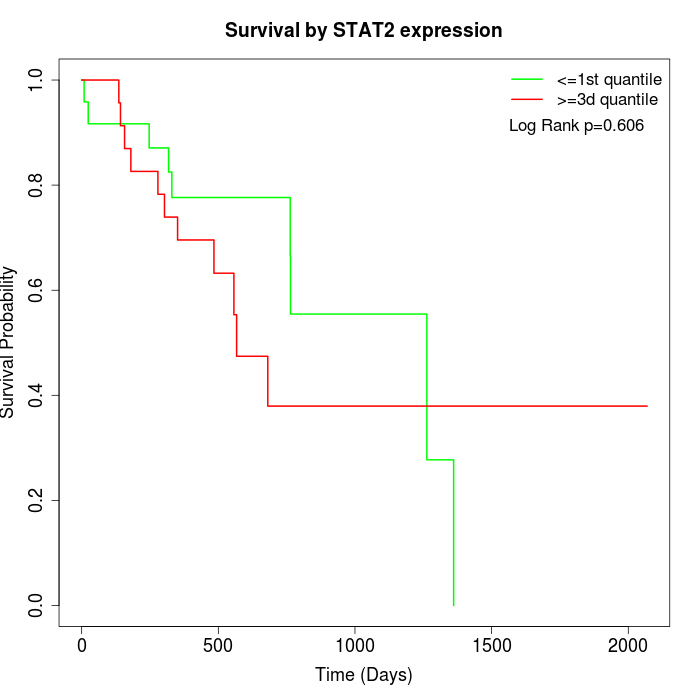 |
| TCGA |
Note: Click image to view full size file.
Copy number change of STAT2:
| Dataset | Gene | EntrezID | Gain | Loss | Normal | Detail |
|---|---|---|---|---|---|---|
| GSE15526 | STAT2 | 6773 | 7 | 2 | 21 | |
| GSE20123 | STAT2 | 6773 | 7 | 1 | 22 | |
| GSE43470 | STAT2 | 6773 | 4 | 0 | 39 | |
| GSE46452 | STAT2 | 6773 | 8 | 1 | 50 | |
| GSE47630 | STAT2 | 6773 | 10 | 2 | 28 | |
| GSE54993 | STAT2 | 6773 | 0 | 5 | 65 | |
| GSE54994 | STAT2 | 6773 | 4 | 1 | 48 | |
| GSE60625 | STAT2 | 6773 | 0 | 0 | 11 | |
| GSE74703 | STAT2 | 6773 | 4 | 0 | 32 | |
| GSE74704 | STAT2 | 6773 | 4 | 1 | 15 | |
| TCGA | STAT2 | 6773 | 14 | 10 | 72 |
Total number of gains: 62; Total number of losses: 23; Total Number of normals: 403.
Somatic mutations of STAT2:
Generating mutation plots.
Highly correlated genes for STAT2:
Showing top 20/672 corelated genes with mean PCC>0.5.
| Gene1 | Gene2 | Mean PCC | Num. Datasets | Num. PCC<0 | Num. PCC>0.5 |
|---|---|---|---|---|---|
| STAT2 | HNRNPUL1 | 0.841475 | 3 | 0 | 3 |
| STAT2 | RILPL2 | 0.80956 | 3 | 0 | 3 |
| STAT2 | RICTOR | 0.804247 | 4 | 0 | 4 |
| STAT2 | UBTD2 | 0.795178 | 3 | 0 | 3 |
| STAT2 | TMTC4 | 0.787888 | 3 | 0 | 3 |
| STAT2 | ZNF766 | 0.781124 | 3 | 0 | 3 |
| STAT2 | PLEKHA3 | 0.777854 | 3 | 0 | 3 |
| STAT2 | ENTPD2 | 0.777039 | 3 | 0 | 3 |
| STAT2 | USP42 | 0.772541 | 3 | 0 | 3 |
| STAT2 | THAP5 | 0.771869 | 3 | 0 | 3 |
| STAT2 | SPRED1 | 0.771846 | 3 | 0 | 3 |
| STAT2 | ARID1B | 0.761983 | 3 | 0 | 3 |
| STAT2 | NPFFR1 | 0.756326 | 5 | 0 | 5 |
| STAT2 | DVL2 | 0.753489 | 3 | 0 | 3 |
| STAT2 | CMPK2 | 0.749918 | 5 | 0 | 5 |
| STAT2 | TP53I11 | 0.748777 | 5 | 0 | 5 |
| STAT2 | ITGAV | 0.747508 | 4 | 0 | 3 |
| STAT2 | BRCA1 | 0.739983 | 4 | 0 | 4 |
| STAT2 | CYP1A2 | 0.738595 | 4 | 0 | 4 |
| STAT2 | RAB8B | 0.737308 | 4 | 0 | 4 |
For details and further investigation, click here