| Full name: epithelial stromal interaction 1 | Alias Symbol: BRESI1|MGC29634 | ||
| Type: protein-coding gene | Cytoband: 13q14.11 | ||
| Entrez ID: 94240 | HGNC ID: HGNC:16465 | Ensembl Gene: ENSG00000133106 | OMIM ID: 607441 |
Expression of EPSTI1:
| Dataset | Gene | EntrezID | Probe | Log2FC | Adj.pValue | Expression |
|---|---|---|---|---|---|---|
| GSE17351 | EPSTI1 | 94240 | 227609_at | 0.7458 | 0.6439 | |
| GSE26886 | EPSTI1 | 94240 | 227609_at | 0.2989 | 0.6753 | |
| GSE45670 | EPSTI1 | 94240 | 227609_at | 2.0707 | 0.0002 | |
| GSE53622 | EPSTI1 | 94240 | 96334 | 1.1473 | 0.0000 | |
| GSE53624 | EPSTI1 | 94240 | 96334 | 1.2819 | 0.0000 | |
| GSE63941 | EPSTI1 | 94240 | 227609_at | -1.8958 | 0.0800 | |
| GSE77861 | EPSTI1 | 94240 | 227609_at | 0.3752 | 0.4058 | |
| GSE97050 | EPSTI1 | 94240 | A_23_P105794 | 1.0071 | 0.1949 | |
| SRP007169 | EPSTI1 | 94240 | RNAseq | 1.2863 | 0.0225 | |
| SRP008496 | EPSTI1 | 94240 | RNAseq | 1.8565 | 0.0000 | |
| SRP064894 | EPSTI1 | 94240 | RNAseq | 2.1641 | 0.0000 | |
| SRP133303 | EPSTI1 | 94240 | RNAseq | 1.1688 | 0.0007 | |
| SRP159526 | EPSTI1 | 94240 | RNAseq | -0.2735 | 0.7271 | |
| SRP193095 | EPSTI1 | 94240 | RNAseq | 1.0684 | 0.0001 | |
| SRP219564 | EPSTI1 | 94240 | RNAseq | 1.3681 | 0.1422 | |
| TCGA | EPSTI1 | 94240 | RNAseq | 0.6323 | 0.0002 |
Upregulated datasets: 8; Downregulated datasets: 0.
Survival by EPSTI1 expression:
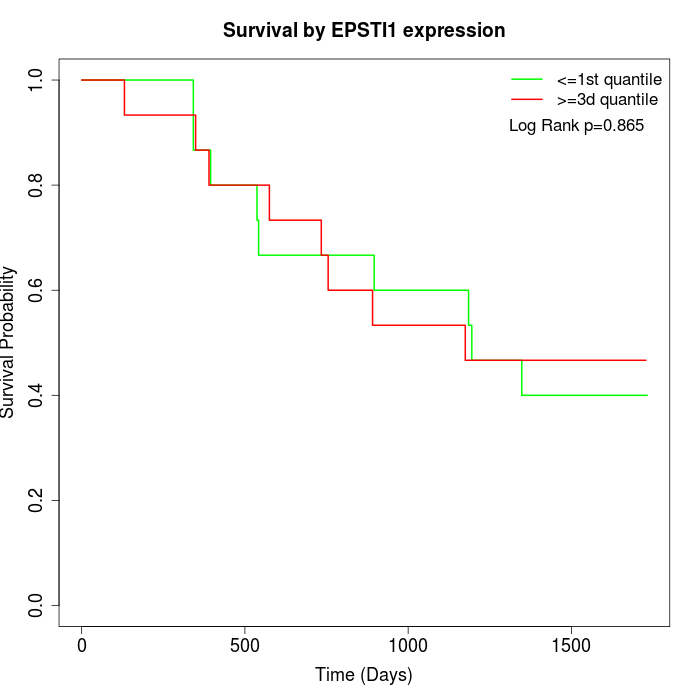 | 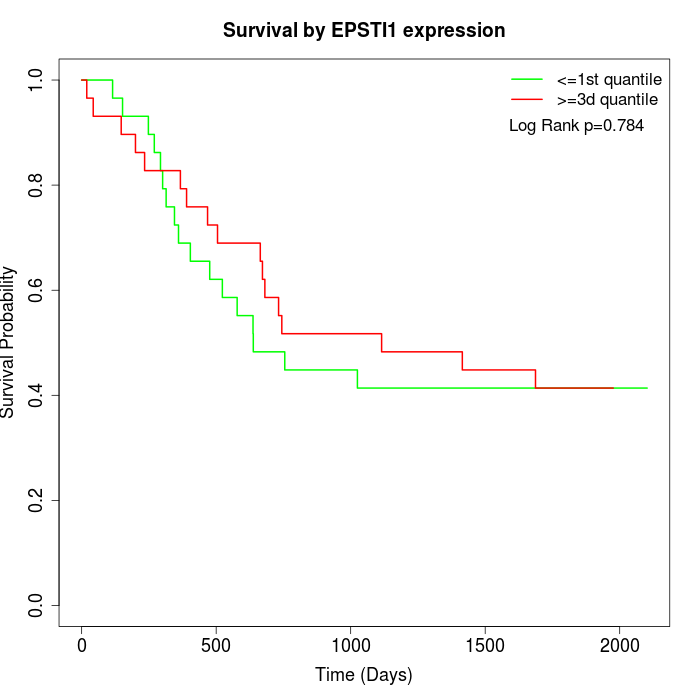 | 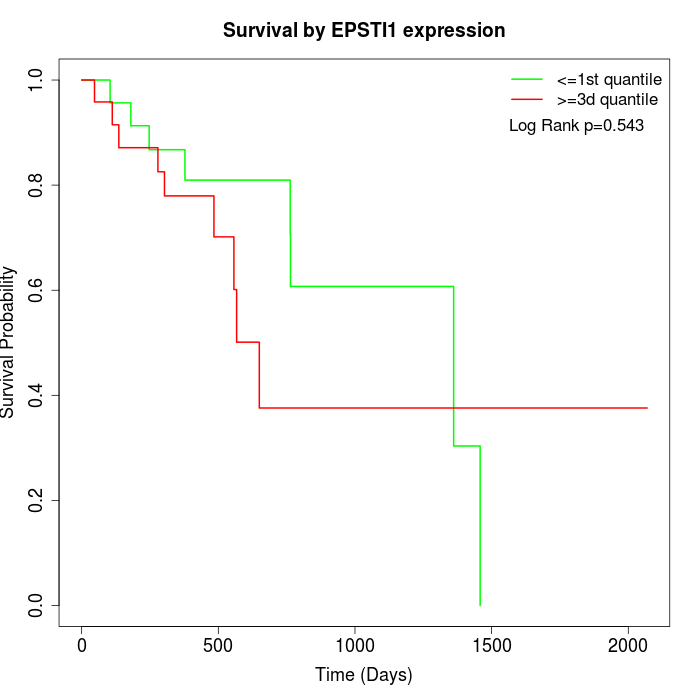 |
| GSE53622 | GSE53624 | TCGA |
Note: Click image to view full size file.
Copy number change of EPSTI1:
| Dataset | Gene | EntrezID | Gain | Loss | Normal | Detail |
|---|---|---|---|---|---|---|
| GSE15526 | EPSTI1 | 94240 | 0 | 13 | 17 | |
| GSE20123 | EPSTI1 | 94240 | 0 | 12 | 18 | |
| GSE43470 | EPSTI1 | 94240 | 3 | 13 | 27 | |
| GSE46452 | EPSTI1 | 94240 | 0 | 33 | 26 | |
| GSE47630 | EPSTI1 | 94240 | 2 | 27 | 11 | |
| GSE54993 | EPSTI1 | 94240 | 12 | 2 | 56 | |
| GSE54994 | EPSTI1 | 94240 | 1 | 16 | 36 | |
| GSE60625 | EPSTI1 | 94240 | 0 | 3 | 8 | |
| GSE74703 | EPSTI1 | 94240 | 3 | 10 | 23 | |
| GSE74704 | EPSTI1 | 94240 | 0 | 9 | 11 | |
| TCGA | EPSTI1 | 94240 | 8 | 40 | 48 |
Total number of gains: 29; Total number of losses: 178; Total Number of normals: 281.
Somatic mutations of EPSTI1:
Generating mutation plots.
Highly correlated genes for EPSTI1:
Showing top 20/527 corelated genes with mean PCC>0.5.
| Gene1 | Gene2 | Mean PCC | Num. Datasets | Num. PCC<0 | Num. PCC>0.5 |
|---|---|---|---|---|---|
| EPSTI1 | IFI44 | 0.836333 | 7 | 0 | 7 |
| EPSTI1 | CXCL10 | 0.824928 | 7 | 0 | 7 |
| EPSTI1 | IFIH1 | 0.819537 | 5 | 0 | 5 |
| EPSTI1 | CXCL11 | 0.804289 | 7 | 0 | 7 |
| EPSTI1 | DDX60 | 0.800011 | 8 | 0 | 8 |
| EPSTI1 | RSAD2 | 0.78584 | 8 | 0 | 7 |
| EPSTI1 | GBP1 | 0.782707 | 8 | 0 | 7 |
| EPSTI1 | CMPK2 | 0.780825 | 7 | 0 | 6 |
| EPSTI1 | OAS2 | 0.779021 | 7 | 0 | 7 |
| EPSTI1 | IFI44L | 0.765964 | 8 | 0 | 7 |
| EPSTI1 | STAT1 | 0.764941 | 9 | 0 | 8 |
| EPSTI1 | IFIT3 | 0.760756 | 8 | 0 | 8 |
| EPSTI1 | CXCL9 | 0.758311 | 8 | 0 | 7 |
| EPSTI1 | USP41 | 0.754011 | 3 | 0 | 3 |
| EPSTI1 | PARP9 | 0.745647 | 7 | 0 | 6 |
| EPSTI1 | FCGR3A | 0.744388 | 3 | 0 | 3 |
| EPSTI1 | IFIT1 | 0.741972 | 8 | 0 | 8 |
| EPSTI1 | XAF1 | 0.739684 | 9 | 0 | 8 |
| EPSTI1 | LAIR1 | 0.738236 | 4 | 0 | 4 |
| EPSTI1 | IFI35 | 0.737406 | 8 | 0 | 8 |
For details and further investigation, click here