| Full name: proteasome subunit beta 9 | Alias Symbol: RING12|beta1i|PSMB6i | ||
| Type: protein-coding gene | Cytoband: 6p21.32 | ||
| Entrez ID: 5698 | HGNC ID: HGNC:9546 | Ensembl Gene: ENSG00000240065 | OMIM ID: 177045 |
| Related drugs: BORTEZOMIB, CARFILZOMIB, IXAZOMIB CITRATE, MARIZOMIB, OPROZOMIB... [more] | |||
Expression of PSMB9:
| Dataset | Gene | EntrezID | Probe | Log2FC | Adj.pValue | Expression |
|---|---|---|---|---|---|---|
| GSE17351 | PSMB9 | 5698 | 204279_at | 1.1738 | 0.1553 | |
| GSE20347 | PSMB9 | 5698 | 204279_at | 1.0416 | 0.0025 | |
| GSE23400 | PSMB9 | 5698 | 204279_at | 1.1900 | 0.0000 | |
| GSE26886 | PSMB9 | 5698 | 204279_at | 0.4506 | 0.4055 | |
| GSE29001 | PSMB9 | 5698 | 204279_at | 1.7450 | 0.0002 | |
| GSE38129 | PSMB9 | 5698 | 204279_at | 0.9490 | 0.0009 | |
| GSE45670 | PSMB9 | 5698 | 204279_at | 1.3251 | 0.0039 | |
| GSE53622 | PSMB9 | 5698 | 164943 | 0.3733 | 0.0000 | |
| GSE53624 | PSMB9 | 5698 | 164943 | 0.4546 | 0.0000 | |
| GSE63941 | PSMB9 | 5698 | 204279_at | 0.1347 | 0.9332 | |
| GSE77861 | PSMB9 | 5698 | 204279_at | 0.3431 | 0.5099 | |
| GSE97050 | PSMB9 | 5698 | A_23_P111000 | 0.3761 | 0.2484 | |
| SRP007169 | PSMB9 | 5698 | RNAseq | 1.7360 | 0.0156 | |
| SRP008496 | PSMB9 | 5698 | RNAseq | 1.1211 | 0.0287 | |
| SRP064894 | PSMB9 | 5698 | RNAseq | 1.1802 | 0.0001 | |
| SRP133303 | PSMB9 | 5698 | RNAseq | 1.1499 | 0.0001 | |
| SRP159526 | PSMB9 | 5698 | RNAseq | 0.5974 | 0.3789 | |
| SRP193095 | PSMB9 | 5698 | RNAseq | 0.6488 | 0.0058 | |
| SRP219564 | PSMB9 | 5698 | RNAseq | 2.3818 | 0.0003 | |
| TCGA | PSMB9 | 5698 | RNAseq | 0.6270 | 0.0000 |
Upregulated datasets: 9; Downregulated datasets: 0.
Survival by PSMB9 expression:
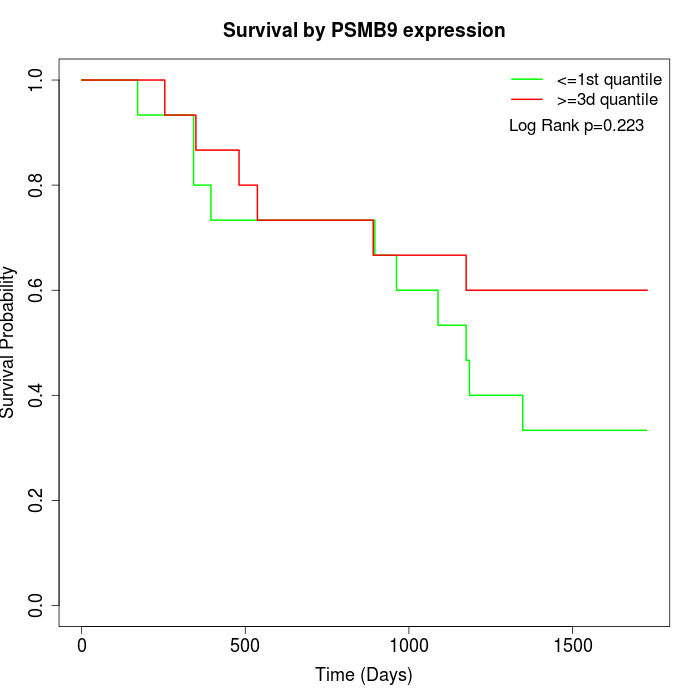 | 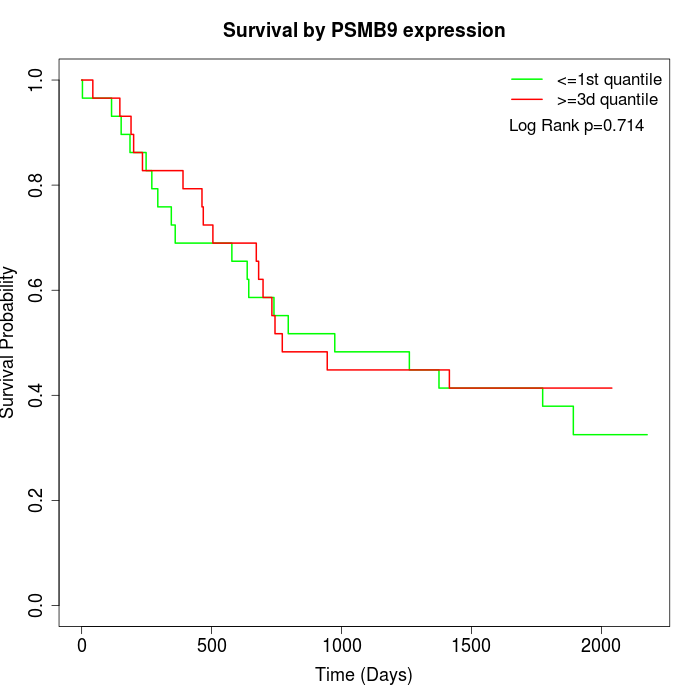 | 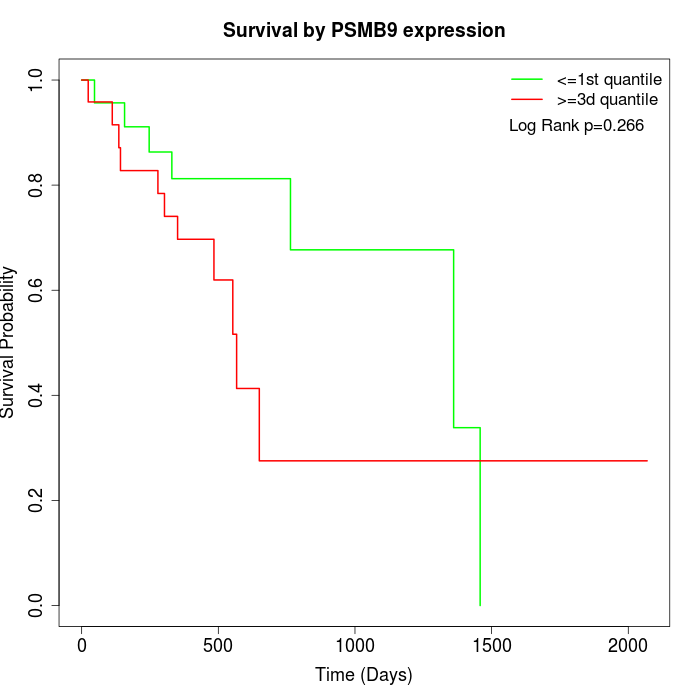 |
| GSE53622 | GSE53624 | TCGA |
Note: Click image to view full size file.
Copy number change of PSMB9:
| Dataset | Gene | EntrezID | Gain | Loss | Normal | Detail |
|---|---|---|---|---|---|---|
| GSE15526 | PSMB9 | 5698 | 5 | 0 | 25 | |
| GSE20123 | PSMB9 | 5698 | 5 | 0 | 25 | |
| GSE43470 | PSMB9 | 5698 | 5 | 1 | 37 | |
| GSE46452 | PSMB9 | 5698 | 2 | 9 | 48 | |
| GSE47630 | PSMB9 | 5698 | 8 | 4 | 28 | |
| GSE54993 | PSMB9 | 5698 | 3 | 1 | 66 | |
| GSE54994 | PSMB9 | 5698 | 11 | 4 | 38 | |
| GSE60625 | PSMB9 | 5698 | 1 | 0 | 10 | |
| GSE74703 | PSMB9 | 5698 | 5 | 0 | 31 | |
| GSE74704 | PSMB9 | 5698 | 2 | 0 | 18 | |
| TCGA | PSMB9 | 5698 | 16 | 16 | 64 |
Total number of gains: 63; Total number of losses: 35; Total Number of normals: 390.
Somatic mutations of PSMB9:
Generating mutation plots.
Highly correlated genes for PSMB9:
Showing top 20/398 corelated genes with mean PCC>0.5.
| Gene1 | Gene2 | Mean PCC | Num. Datasets | Num. PCC<0 | Num. PCC>0.5 |
|---|---|---|---|---|---|
| PSMB9 | PSMB8 | 0.82783 | 12 | 0 | 12 |
| PSMB9 | TAP1 | 0.807687 | 10 | 0 | 10 |
| PSMB9 | HLA-F | 0.788702 | 12 | 0 | 11 |
| PSMB9 | UBE2L6 | 0.788698 | 13 | 0 | 13 |
| PSMB9 | HLA-B | 0.782276 | 13 | 0 | 13 |
| PSMB9 | BTN3A3 | 0.764654 | 10 | 0 | 10 |
| PSMB9 | HLA-A | 0.761492 | 12 | 0 | 11 |
| PSMB9 | HLA-C | 0.75734 | 13 | 0 | 13 |
| PSMB9 | IFI35 | 0.735289 | 12 | 0 | 11 |
| PSMB9 | RTP4 | 0.703373 | 12 | 0 | 12 |
| PSMB9 | MAST3 | 0.695987 | 3 | 0 | 3 |
| PSMB9 | GNLY | 0.695966 | 11 | 0 | 11 |
| PSMB9 | GBP5 | 0.693263 | 6 | 0 | 6 |
| PSMB9 | IFITM1 | 0.691925 | 9 | 0 | 9 |
| PSMB9 | PSMB10 | 0.690074 | 12 | 0 | 10 |
| PSMB9 | HLA-G | 0.687489 | 11 | 0 | 9 |
| PSMB9 | BATF2 | 0.686629 | 6 | 0 | 5 |
| PSMB9 | RNF213 | 0.685991 | 4 | 0 | 4 |
| PSMB9 | DDX60 | 0.685676 | 12 | 0 | 12 |
| PSMB9 | DTX3L | 0.685418 | 8 | 0 | 7 |
For details and further investigation, click here